ZynexInc ZYXI full analysis,charts,indicators,moving averages,SMA,DMA,EMA,ADX,MACD,RSIZynex Inc ZYXI WideScreen charts, DMA,SMA,EMA technical analysis, forecast prediction, by indicators ADX,MACD,RSI,CCI USA stock exchange
operates under Health Care sector & deals in Biotechnology Electromedical Electrotherapeutic Apparatus
Daily price and charts and targets ZynexInc Strong Daily Stock price targets for ZynexInc ZYXI are 0.92 and 1.1 | Daily Target 1 | 0.89 | | Daily Target 2 | 0.95 | | Daily Target 3 | 1.0666666666667 | | Daily Target 4 | 1.13 | | Daily Target 5 | 1.25 |
Daily price and volume Zynex Inc
| Date |
Closing |
Open |
Range |
Volume |
Thu 04 December 2025 |
1.02 (-12.07%) |
1.16 |
1.00 - 1.18 |
0.0601 times |
Wed 03 December 2025 |
1.16 (-2.52%) |
1.13 |
1.13 - 1.35 |
0.0836 times |
Tue 02 December 2025 |
1.19 (-3.25%) |
1.20 |
1.08 - 1.33 |
0.1081 times |
Mon 01 December 2025 |
1.23 (-2.38%) |
1.21 |
1.21 - 1.50 |
0.3841 times |
Fri 28 November 2025 |
1.26 (-20.75%) |
1.44 |
1.21 - 1.68 |
0.4962 times |
Wed 26 November 2025 |
1.59 (117.81%) |
0.73 |
0.70 - 2.10 |
7.4771 times |
Tue 25 November 2025 |
0.73 (-1.35%) |
0.75 |
0.69 - 0.80 |
0.0742 times |
Mon 24 November 2025 |
0.74 (19.35%) |
0.62 |
0.60 - 0.88 |
0.6798 times |
Fri 21 November 2025 |
0.62 (29.17%) |
0.47 |
0.47 - 0.66 |
0.4507 times |
Thu 20 November 2025 |
0.48 (-14.29%) |
0.54 |
0.44 - 0.58 |
0.1861 times |
Wed 19 November 2025 |
0.56 (33.33%) |
0.46 |
0.42 - 0.74 |
5.7745 times |
Weekly price and charts ZynexInc Strong weekly Stock price targets for ZynexInc ZYXI are 0.76 and 1.26 | Weekly Target 1 | 0.67 | | Weekly Target 2 | 0.85 | | Weekly Target 3 | 1.1733333333333 | | Weekly Target 4 | 1.35 | | Weekly Target 5 | 1.67 |
Weekly price and volumes for Zynex Inc
| Date |
Closing |
Open |
Range |
Volume |
Thu 04 December 2025 |
1.02 (-19.05%) |
1.21 |
1.00 - 1.50 |
0.3916 times |
Fri 28 November 2025 |
1.26 (103.23%) |
0.62 |
0.60 - 2.10 |
5.3741 times |
Fri 21 November 2025 |
0.62 (8.77%) |
0.61 |
0.38 - 0.74 |
4.0541 times |
Fri 14 November 2025 |
0.57 (-45.19%) |
1.03 |
0.51 - 1.20 |
0.1003 times |
Fri 07 November 2025 |
1.04 (-9.57%) |
1.13 |
1.03 - 1.19 |
0.015 times |
Fri 31 October 2025 |
1.15 (0%) |
1.21 |
1.13 - 1.23 |
0.0057 times |
Fri 31 October 2025 |
1.15 (-17.86%) |
1.39 |
1.13 - 1.42 |
0.0174 times |
Fri 24 October 2025 |
1.40 (5.26%) |
1.34 |
1.32 - 1.47 |
0.016 times |
Fri 17 October 2025 |
1.33 (-3.62%) |
1.41 |
1.30 - 1.43 |
0.01 times |
Fri 10 October 2025 |
1.38 (-6.12%) |
1.45 |
1.35 - 1.52 |
0.0158 times |
Fri 03 October 2025 |
1.47 (1.38%) |
1.45 |
1.41 - 1.50 |
0.0114 times |

Monthly price and charts ZynexInc Strong monthly Stock price targets for ZynexInc ZYXI are 0.76 and 1.26 | Monthly Target 1 | 0.67 | | Monthly Target 2 | 0.85 | | Monthly Target 3 | 1.1733333333333 | | Monthly Target 4 | 1.35 | | Monthly Target 5 | 1.67 |
Monthly price and volumes Zynex Inc
| Date |
Closing |
Open |
Range |
Volume |
Thu 04 December 2025 |
1.02 (-19.05%) |
1.21 |
1.00 - 1.50 |
0.3482 times |
Fri 28 November 2025 |
1.26 (9.57%) |
1.13 |
0.38 - 2.10 |
8.4857 times |
Fri 31 October 2025 |
1.15 (-20.69%) |
1.42 |
1.13 - 1.52 |
0.0627 times |
Tue 30 September 2025 |
1.45 (-11.59%) |
1.61 |
1.41 - 1.68 |
0.0634 times |
Fri 29 August 2025 |
1.64 (-26.46%) |
2.11 |
1.23 - 2.11 |
0.1798 times |
Thu 31 July 2025 |
2.23 (-13.57%) |
2.58 |
2.05 - 2.82 |
0.0946 times |
Mon 30 June 2025 |
2.58 (10.26%) |
2.35 |
1.99 - 2.82 |
0.1785 times |
Fri 30 May 2025 |
2.34 (40.96%) |
1.75 |
1.70 - 2.66 |
0.1267 times |
Wed 30 April 2025 |
1.66 (-24.55%) |
2.18 |
1.66 - 2.58 |
0.1554 times |
Mon 31 March 2025 |
2.20 (-69.49%) |
7.26 |
2.14 - 7.43 |
0.3049 times |
Fri 28 February 2025 |
7.21 (-8.04%) |
7.72 |
7.12 - 8.13 |
0.0489 times |

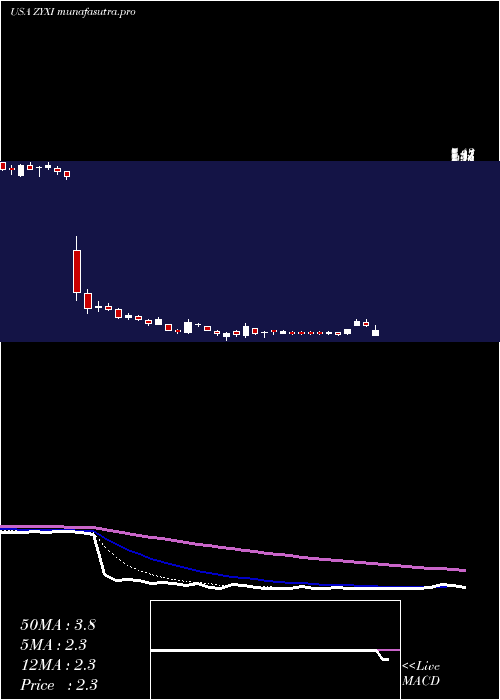
DMA SMA EMA moving averages of Zynex Inc ZYXI
DMA (daily moving average) of Zynex Inc ZYXI
| DMA period | DMA value | | 5 day DMA | 1.17 | | 12 day DMA | 0.92 | | 20 day DMA | 0.92 | | 35 day DMA | 1.08 | | 50 day DMA | 1.19 | | 100 day DMA | 1.47 | | 150 day DMA | 1.75 | | 200 day DMA | 2.3 | EMA (exponential moving average) of Zynex Inc ZYXI
| EMA period | EMA current | EMA prev | EMA prev2 | | 5 day EMA | 1.11 | 1.15 | 1.14 | | 12 day EMA | 1.04 | 1.04 | 1.02 | | 20 day EMA | 1.02 | 1.02 | 1.01 | | 35 day EMA | 1.09 | 1.09 | 1.09 | | 50 day EMA | 1.22 | 1.23 | 1.23 |
SMA (simple moving average) of Zynex Inc ZYXI
| SMA period | SMA current | SMA prev | SMA prev2 | | 5 day SMA | 1.17 | 1.29 | 1.2 | | 12 day SMA | 0.92 | 0.88 | 0.83 | | 20 day SMA | 0.92 | 0.93 | 0.93 | | 35 day SMA | 1.08 | 1.09 | 1.1 | | 50 day SMA | 1.19 | 1.2 | 1.21 | | 100 day SMA | 1.47 | 1.48 | 1.49 | | 150 day SMA | 1.75 | 1.75 | 1.76 | | 200 day SMA | 2.3 | 2.33 | 2.36 |
|
|
