ZionsBancorporation ZION full analysis,charts,indicators,moving averages,SMA,DMA,EMA,ADX,MACD,RSIZions Bancorporation ZION WideScreen charts, DMA,SMA,EMA technical analysis, forecast prediction, by indicators ADX,MACD,RSI,CCI USA stock exchange
operates under Finance sector & deals in Major Banks
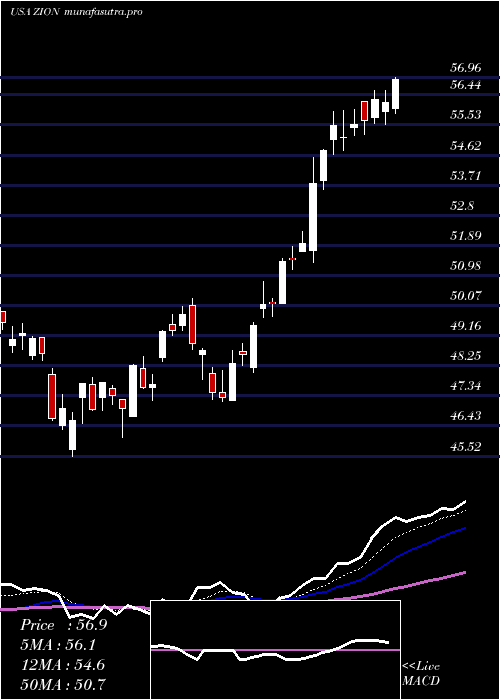
Daily price and charts and targets ZionsBancorporation Strong Daily Stock price targets for ZionsBancorporation ZION are 55.17 and 56.41 | Daily Target 1 | 54.15 | | Daily Target 2 | 54.94 | | Daily Target 3 | 55.39 | | Daily Target 4 | 56.18 | | Daily Target 5 | 56.63 |
Daily price and volume Zions Bancorporation
| Date |
Closing |
Open |
Range |
Volume |
Thu 04 December 2025 |
55.73 (1.66%) |
54.67 |
54.60 - 55.84 |
0.7474 times |
Wed 03 December 2025 |
54.82 (1.41%) |
54.12 |
53.96 - 55.06 |
0.922 times |
Tue 02 December 2025 |
54.06 (-0.04%) |
53.99 |
53.68 - 54.65 |
1.3426 times |
Mon 01 December 2025 |
54.08 (1.6%) |
52.87 |
52.60 - 54.15 |
0.8729 times |
Fri 28 November 2025 |
53.23 (-0.06%) |
53.56 |
53.16 - 53.77 |
0.4019 times |
Wed 26 November 2025 |
53.26 (0.06%) |
53.06 |
53.06 - 53.67 |
0.5757 times |
Tue 25 November 2025 |
53.23 (2.58%) |
52.04 |
52.04 - 53.84 |
1.1298 times |
Mon 24 November 2025 |
51.89 (-0.44%) |
52.13 |
51.77 - 52.62 |
1.1375 times |
Fri 21 November 2025 |
52.12 (3.33%) |
50.72 |
50.47 - 52.61 |
1.6066 times |
Thu 20 November 2025 |
50.44 (0.02%) |
51.01 |
50.19 - 51.80 |
1.2635 times |
Wed 19 November 2025 |
50.43 (2.21%) |
50.10 |
49.63 - 50.66 |
1.1461 times |
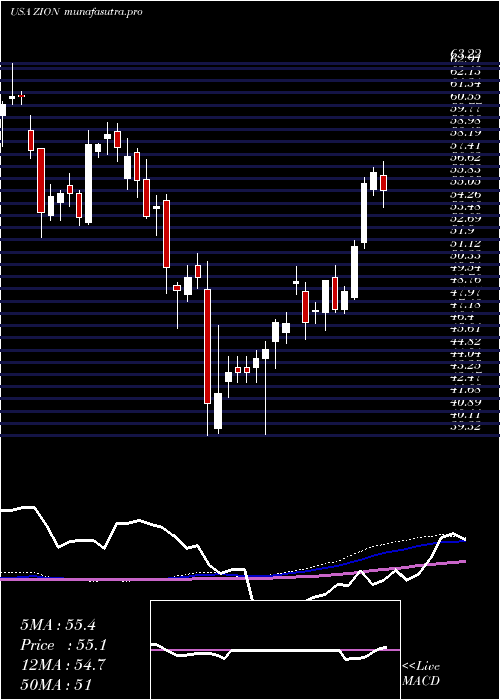
Weekly price and charts ZionsBancorporation Strong weekly Stock price targets for ZionsBancorporation ZION are 54.17 and 57.41 | Weekly Target 1 | 51.48 | | Weekly Target 2 | 53.61 | | Weekly Target 3 | 54.723333333333 | | Weekly Target 4 | 56.85 | | Weekly Target 5 | 57.96 |
Weekly price and volumes for Zions Bancorporation
| Date |
Closing |
Open |
Range |
Volume |
Thu 04 December 2025 |
55.73 (4.7%) |
52.87 |
52.60 - 55.84 |
0.6569 times |
Fri 28 November 2025 |
53.23 (2.13%) |
52.13 |
51.77 - 53.84 |
0.5487 times |
Fri 21 November 2025 |
52.12 (2.16%) |
50.81 |
48.50 - 52.61 |
1.1267 times |
Fri 14 November 2025 |
51.02 (-2.34%) |
52.47 |
50.04 - 53.76 |
0.8996 times |
Fri 07 November 2025 |
52.24 (0.25%) |
51.36 |
50.57 - 52.65 |
0.7084 times |
Fri 31 October 2025 |
52.11 (0%) |
51.62 |
51.21 - 52.23 |
0.2114 times |
Fri 31 October 2025 |
52.11 (-1.9%) |
53.64 |
51.21 - 54.00 |
1.2376 times |
Fri 24 October 2025 |
53.12 (6.56%) |
50.11 |
49.82 - 53.99 |
1.3602 times |
Fri 17 October 2025 |
49.85 (-4.78%) |
53.43 |
46.08 - 55.81 |
2.3707 times |
Fri 10 October 2025 |
52.35 (-8.04%) |
57.33 |
52.27 - 58.54 |
0.8798 times |
Fri 03 October 2025 |
56.93 (-1.06%) |
57.91 |
55.42 - 57.91 |
0.7382 times |
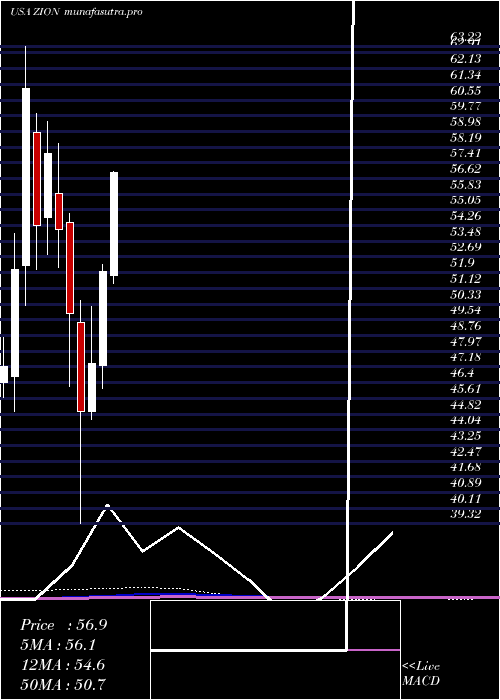
Monthly price and charts ZionsBancorporation Strong monthly Stock price targets for ZionsBancorporation ZION are 54.17 and 57.41 | Monthly Target 1 | 51.48 | | Monthly Target 2 | 53.61 | | Monthly Target 3 | 54.723333333333 | | Monthly Target 4 | 56.85 | | Monthly Target 5 | 57.96 |
Monthly price and volumes Zions Bancorporation
| Date |
Closing |
Open |
Range |
Volume |
Thu 04 December 2025 |
55.73 (4.7%) |
52.87 |
52.60 - 55.84 |
0.1624 times |
Fri 28 November 2025 |
53.23 (2.15%) |
51.36 |
48.50 - 53.84 |
0.8119 times |
Fri 31 October 2025 |
52.11 (-7.9%) |
56.44 |
46.08 - 58.54 |
1.5918 times |
Tue 30 September 2025 |
56.58 (-2.47%) |
57.11 |
55.42 - 59.40 |
0.9972 times |
Fri 29 August 2025 |
58.01 (8.19%) |
52.45 |
50.66 - 58.46 |
0.9284 times |
Thu 31 July 2025 |
53.62 (3.23%) |
51.75 |
51.36 - 58.05 |
1.0991 times |
Mon 30 June 2025 |
51.94 (9.67%) |
47.24 |
46.09 - 52.31 |
0.6982 times |
Fri 30 May 2025 |
47.36 (5.31%) |
44.94 |
44.55 - 50.21 |
0.9501 times |
Wed 30 April 2025 |
44.97 (-9.81%) |
49.39 |
39.32 - 50.49 |
1.4214 times |
Mon 31 March 2025 |
49.86 (-7.74%) |
54.41 |
46.19 - 54.85 |
1.3396 times |
Fri 28 February 2025 |
54.04 (-6.6%) |
55.87 |
52.16 - 58.39 |
0.7752 times |
DMA SMA EMA moving averages of Zions Bancorporation ZION
DMA (daily moving average) of Zions Bancorporation ZION
| DMA period | DMA value | | 5 day DMA | 54.38 | | 12 day DMA | 52.72 | | 20 day DMA | 52.24 | | 35 day DMA | 51.96 | | 50 day DMA | 53.16 | | 100 day DMA | 54.42 | | 150 day DMA | 52.84 | | 200 day DMA | 51.6 | EMA (exponential moving average) of Zions Bancorporation ZION
| EMA period | EMA current | EMA prev | EMA prev2 | | 5 day EMA | 54.51 | 53.9 | 53.44 | | 12 day EMA | 53.37 | 52.94 | 52.6 | | 20 day EMA | 52.93 | 52.63 | 52.4 | | 35 day EMA | 53.16 | 53.01 | 52.9 | | 50 day EMA | 53.66 | 53.58 | 53.53 |
SMA (simple moving average) of Zions Bancorporation ZION
| SMA period | SMA current | SMA prev | SMA prev2 | | 5 day SMA | 54.38 | 53.89 | 53.57 | | 12 day SMA | 52.72 | 52.15 | 51.84 | | 20 day SMA | 52.24 | 52.04 | 51.87 | | 35 day SMA | 51.96 | 51.92 | 51.93 | | 50 day SMA | 53.16 | 53.18 | 53.23 | | 100 day SMA | 54.42 | 54.4 | 54.43 | | 150 day SMA | 52.84 | 52.77 | 52.7 | | 200 day SMA | 51.6 | 51.6 | 51.61 |
|
|
