ZillowGroup ZG full analysis,charts,indicators,moving averages,SMA,DMA,EMA,ADX,MACD,RSIZillow Group ZG WideScreen charts, DMA,SMA,EMA technical analysis, forecast prediction, by indicators ADX,MACD,RSI,CCI USA stock exchange
operates under Miscellaneous sector & deals in Business Services
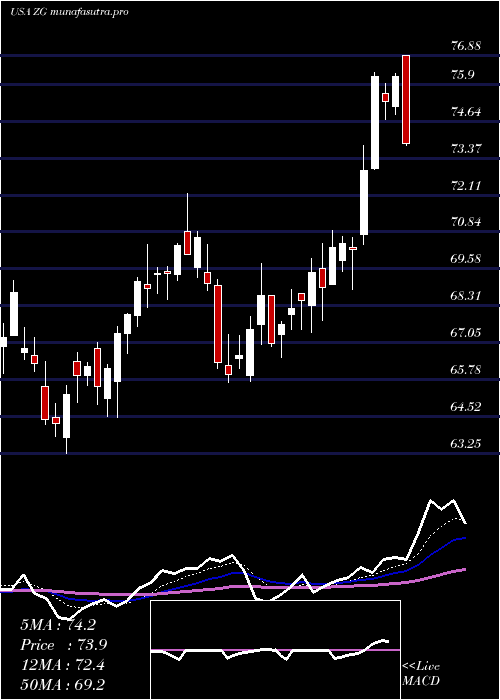
Daily price and charts and targets ZillowGroup Strong Daily Stock price targets for ZillowGroup ZG are 71.95 and 73.76 | Daily Target 1 | 71.48 | | Daily Target 2 | 72.42 | | Daily Target 3 | 73.286666666667 | | Daily Target 4 | 74.23 | | Daily Target 5 | 75.1 |
Daily price and volume Zillow Group
| Date |
Closing |
Open |
Range |
Volume |
Thu 04 December 2025 |
73.37 (-0.68%) |
73.87 |
72.34 - 74.15 |
0.5778 times |
Wed 03 December 2025 |
73.87 (5.26%) |
70.99 |
70.56 - 74.22 |
0.889 times |
Tue 02 December 2025 |
70.18 (-1.96%) |
71.83 |
70.09 - 72.09 |
0.7329 times |
Mon 01 December 2025 |
71.58 (-1.06%) |
71.14 |
70.85 - 72.46 |
0.6341 times |
Fri 28 November 2025 |
72.35 (-0.23%) |
72.39 |
71.88 - 72.67 |
0.5652 times |
Wed 26 November 2025 |
72.52 (0.39%) |
71.93 |
71.48 - 73.15 |
0.5792 times |
Tue 25 November 2025 |
72.24 (2.37%) |
70.93 |
70.35 - 72.38 |
1.2657 times |
Mon 24 November 2025 |
70.57 (0.84%) |
69.98 |
69.64 - 70.82 |
1.231 times |
Fri 21 November 2025 |
69.98 (6.5%) |
66.18 |
66.18 - 70.26 |
2.1027 times |
Thu 20 November 2025 |
65.71 (-1.71%) |
67.53 |
65.58 - 68.61 |
1.4223 times |
Wed 19 November 2025 |
66.85 (1.36%) |
66.10 |
65.94 - 67.66 |
1.188 times |
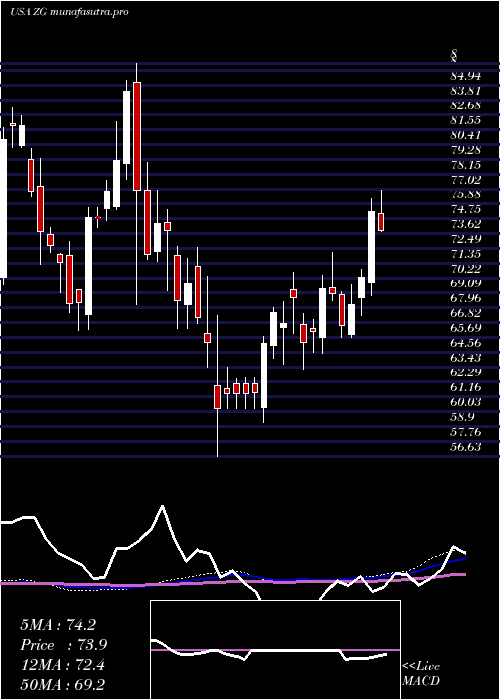
Weekly price and charts ZillowGroup Strong weekly Stock price targets for ZillowGroup ZG are 71.73 and 75.86 | Weekly Target 1 | 68.43 | | Weekly Target 2 | 70.9 | | Weekly Target 3 | 72.56 | | Weekly Target 4 | 75.03 | | Weekly Target 5 | 76.69 |
Weekly price and volumes for Zillow Group
| Date |
Closing |
Open |
Range |
Volume |
Thu 04 December 2025 |
73.37 (1.41%) |
71.14 |
70.09 - 74.22 |
0.6069 times |
Fri 28 November 2025 |
72.35 (3.39%) |
69.98 |
69.64 - 73.15 |
0.7798 times |
Fri 21 November 2025 |
69.98 (4.12%) |
67.30 |
65.57 - 70.26 |
1.6123 times |
Fri 14 November 2025 |
67.21 (-5.08%) |
71.00 |
66.95 - 72.10 |
1.4827 times |
Fri 07 November 2025 |
70.81 (-1.01%) |
70.57 |
68.94 - 71.06 |
0.9254 times |
Fri 31 October 2025 |
71.53 (0%) |
69.96 |
66.65 - 72.08 |
0.4176 times |
Fri 31 October 2025 |
71.53 (-3.69%) |
74.37 |
66.65 - 75.17 |
1.3223 times |
Fri 24 October 2025 |
74.27 (6.37%) |
70.29 |
70.25 - 76.32 |
0.966 times |
Fri 17 October 2025 |
69.82 (4.33%) |
67.46 |
66.24 - 71.94 |
0.9426 times |
Fri 10 October 2025 |
66.92 (-10.04%) |
75.87 |
66.60 - 75.87 |
0.9443 times |
Fri 03 October 2025 |
74.39 (-3.59%) |
77.50 |
70.79 - 78.74 |
1.297 times |
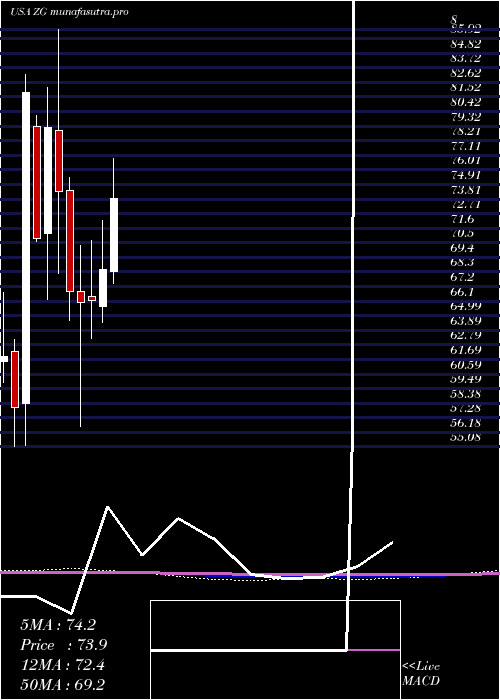
Monthly price and charts ZillowGroup Strong monthly Stock price targets for ZillowGroup ZG are 71.73 and 75.86 | Monthly Target 1 | 68.43 | | Monthly Target 2 | 70.9 | | Monthly Target 3 | 72.56 | | Monthly Target 4 | 75.03 | | Monthly Target 5 | 76.69 |
Monthly price and volumes Zillow Group
| Date |
Closing |
Open |
Range |
Volume |
Thu 04 December 2025 |
73.37 (1.41%) |
71.14 |
70.09 - 74.22 |
0.1499 times |
Fri 28 November 2025 |
72.35 (1.15%) |
70.57 |
65.57 - 73.15 |
1.1854 times |
Fri 31 October 2025 |
71.53 (-3.91%) |
74.28 |
66.24 - 76.32 |
1.3354 times |
Tue 30 September 2025 |
74.44 (-8.64%) |
79.89 |
72.07 - 90.22 |
1.3109 times |
Fri 29 August 2025 |
81.48 (6.16%) |
76.37 |
75.11 - 85.71 |
1.149 times |
Thu 31 July 2025 |
76.75 (12.06%) |
68.32 |
67.39 - 79.31 |
1.0413 times |
Mon 30 June 2025 |
68.49 (3.51%) |
65.72 |
64.49 - 72.16 |
0.7464 times |
Fri 30 May 2025 |
66.17 (0.29%) |
66.43 |
63.25 - 70.68 |
1.0524 times |
Wed 30 April 2025 |
65.98 (-1.32%) |
66.82 |
56.63 - 70.33 |
0.9211 times |
Mon 31 March 2025 |
66.86 (-10.12%) |
74.44 |
64.65 - 75.45 |
1.1082 times |
Fri 28 February 2025 |
74.39 (-6.07%) |
79.00 |
68.18 - 86.58 |
1.4104 times |
DMA SMA EMA moving averages of Zillow Group ZG
DMA (daily moving average) of Zillow Group ZG
| DMA period | DMA value | | 5 day DMA | 72.27 | | 12 day DMA | 70.43 | | 20 day DMA | 70.07 | | 35 day DMA | 70.79 | | 50 day DMA | 71.08 | | 100 day DMA | 75.64 | | 150 day DMA | 73.25 | | 200 day DMA | 71.9 | EMA (exponential moving average) of Zillow Group ZG
| EMA period | EMA current | EMA prev | EMA prev2 | | 5 day EMA | 72.42 | 71.95 | 70.99 | | 12 day EMA | 71.31 | 70.93 | 70.4 | | 20 day EMA | 70.95 | 70.7 | 70.37 | | 35 day EMA | 71.25 | 71.12 | 70.96 | | 50 day EMA | 71.96 | 71.9 | 71.82 |
SMA (simple moving average) of Zillow Group ZG
| SMA period | SMA current | SMA prev | SMA prev2 | | 5 day SMA | 72.27 | 72.1 | 71.77 | | 12 day SMA | 70.43 | 69.91 | 69.35 | | 20 day SMA | 70.07 | 69.91 | 69.71 | | 35 day SMA | 70.79 | 70.69 | 70.56 | | 50 day SMA | 71.08 | 71.14 | 71.19 | | 100 day SMA | 75.64 | 75.65 | 75.67 | | 150 day SMA | 73.25 | 73.2 | 73.15 | | 200 day SMA | 71.9 | 71.91 | 71.92 |
|
|
