YextInc YEXT full analysis,charts,indicators,moving averages,SMA,DMA,EMA,ADX,MACD,RSIYext Inc YEXT WideScreen charts, DMA,SMA,EMA technical analysis, forecast prediction, by indicators ADX,MACD,RSI,CCI USA stock exchange
operates under Technology sector & deals in EDP Services
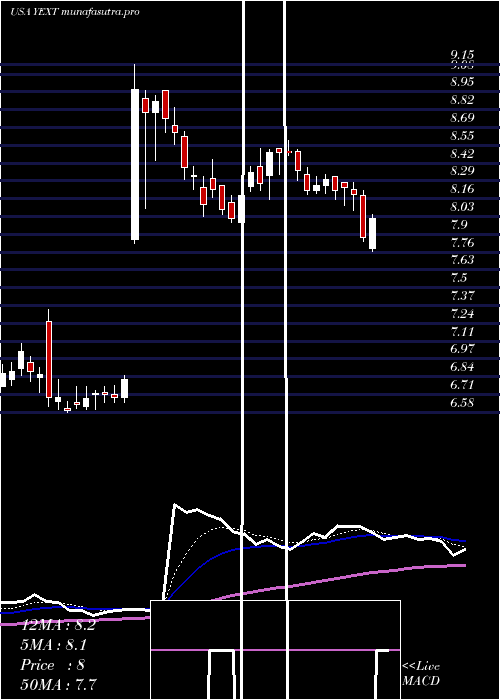
Daily price and charts and targets YextInc Strong Daily Stock price targets for YextInc YEXT are 8.82 and 9.04 | Daily Target 1 | 8.66 | | Daily Target 2 | 8.76 | | Daily Target 3 | 8.88 | | Daily Target 4 | 8.98 | | Daily Target 5 | 9.1 |
Daily price and volume Yext Inc
| Date |
Closing |
Open |
Range |
Volume |
Thu 04 December 2025 |
8.86 (0.45%) |
8.82 |
8.78 - 9.00 |
0.8094 times |
Wed 03 December 2025 |
8.82 (3.52%) |
8.53 |
8.51 - 8.83 |
1.2564 times |
Tue 02 December 2025 |
8.52 (0.59%) |
8.50 |
8.47 - 8.61 |
1.1849 times |
Mon 01 December 2025 |
8.47 (0.59%) |
8.39 |
8.39 - 8.54 |
0.9399 times |
Fri 28 November 2025 |
8.42 (-0.12%) |
8.42 |
8.37 - 8.46 |
0.719 times |
Wed 26 November 2025 |
8.43 (-0.24%) |
8.41 |
8.33 - 8.52 |
1.0848 times |
Tue 25 November 2025 |
8.45 (-0.24%) |
8.49 |
8.30 - 8.57 |
0.8707 times |
Mon 24 November 2025 |
8.47 (0.36%) |
8.43 |
8.43 - 8.56 |
0.8786 times |
Fri 21 November 2025 |
8.44 (2.18%) |
8.25 |
8.23 - 8.50 |
1.0255 times |
Thu 20 November 2025 |
8.26 (-0.36%) |
8.36 |
8.25 - 8.43 |
1.2307 times |
Wed 19 November 2025 |
8.29 (0.12%) |
8.33 |
8.23 - 8.38 |
0.7959 times |
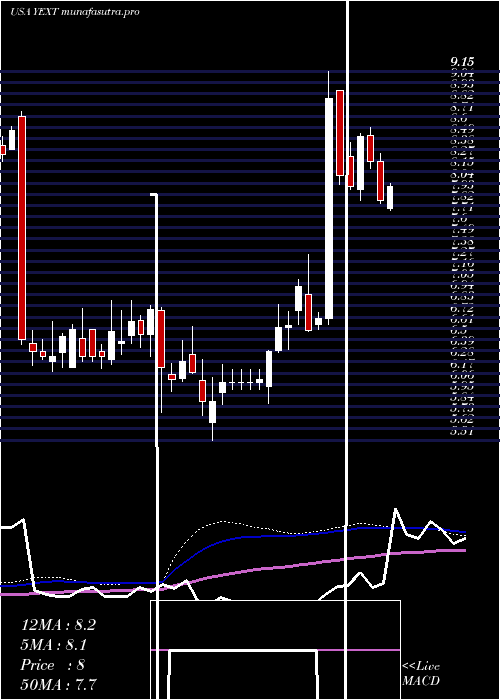
Weekly price and charts YextInc Strong weekly Stock price targets for YextInc YEXT are 8.63 and 9.24 | Weekly Target 1 | 8.14 | | Weekly Target 2 | 8.5 | | Weekly Target 3 | 8.75 | | Weekly Target 4 | 9.11 | | Weekly Target 5 | 9.36 |
Weekly price and volumes for Yext Inc
| Date |
Closing |
Open |
Range |
Volume |
Thu 04 December 2025 |
8.86 (5.23%) |
8.39 |
8.39 - 9.00 |
1.0472 times |
Fri 28 November 2025 |
8.42 (-0.24%) |
8.43 |
8.30 - 8.57 |
0.8879 times |
Fri 21 November 2025 |
8.44 (0%) |
8.40 |
8.20 - 8.50 |
1.2611 times |
Fri 14 November 2025 |
8.44 (-0.47%) |
8.50 |
8.35 - 8.74 |
1.1601 times |
Fri 07 November 2025 |
8.48 (0.12%) |
8.39 |
8.29 - 8.60 |
0.8556 times |
Fri 31 October 2025 |
8.47 (0%) |
8.43 |
8.34 - 8.49 |
0.2101 times |
Fri 31 October 2025 |
8.47 (-0.47%) |
8.55 |
8.26 - 8.59 |
0.9777 times |
Fri 24 October 2025 |
8.51 (2.9%) |
8.29 |
8.27 - 8.66 |
0.855 times |
Fri 17 October 2025 |
8.27 (-0.72%) |
8.37 |
8.18 - 8.47 |
1.3489 times |
Fri 10 October 2025 |
8.33 (-1.07%) |
8.40 |
8.30 - 8.55 |
1.3963 times |
Fri 03 October 2025 |
8.42 (-2.88%) |
8.73 |
8.37 - 8.74 |
1.6758 times |
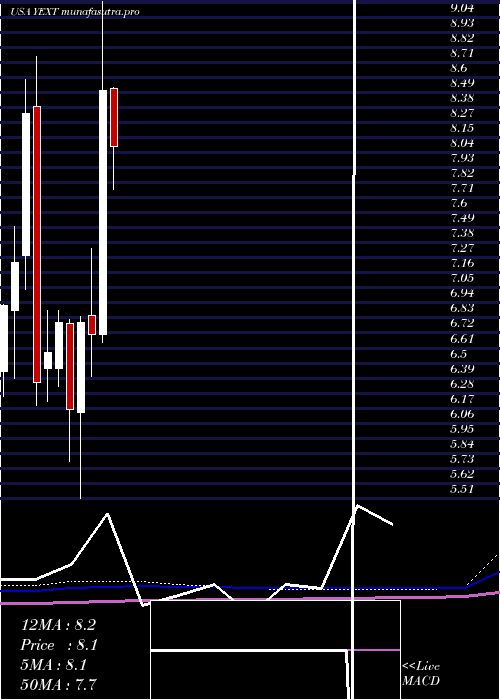
Monthly price and charts YextInc Strong monthly Stock price targets for YextInc YEXT are 8.63 and 9.24 | Monthly Target 1 | 8.14 | | Monthly Target 2 | 8.5 | | Monthly Target 3 | 8.75 | | Monthly Target 4 | 9.11 | | Monthly Target 5 | 9.36 |
Monthly price and volumes Yext Inc
| Date |
Closing |
Open |
Range |
Volume |
Thu 04 December 2025 |
8.86 (5.23%) |
8.39 |
8.39 - 9.00 |
0.1938 times |
Fri 28 November 2025 |
8.42 (-0.59%) |
8.39 |
8.20 - 8.74 |
0.7707 times |
Fri 31 October 2025 |
8.47 (-0.59%) |
8.49 |
8.18 - 8.66 |
1.0508 times |
Tue 30 September 2025 |
8.52 (-6.27%) |
8.96 |
8.42 - 9.19 |
1.4257 times |
Fri 29 August 2025 |
9.09 (11.95%) |
8.08 |
7.72 - 9.20 |
1.3244 times |
Thu 31 July 2025 |
8.12 (-4.47%) |
8.51 |
7.77 - 8.67 |
0.7801 times |
Mon 30 June 2025 |
8.50 (26.68%) |
6.71 |
6.65 - 9.15 |
1.7794 times |
Fri 30 May 2025 |
6.71 (-1.32%) |
6.85 |
6.40 - 7.34 |
0.7305 times |
Wed 30 April 2025 |
6.80 (10.39%) |
6.14 |
5.51 - 6.84 |
0.9183 times |
Mon 31 March 2025 |
6.16 (-9.41%) |
6.79 |
5.78 - 6.82 |
1.0263 times |
Fri 28 February 2025 |
6.80 (3.34%) |
6.46 |
6.33 - 6.89 |
0.5541 times |
DMA SMA EMA moving averages of Yext Inc YEXT
DMA (daily moving average) of Yext Inc YEXT
| DMA period | DMA value | | 5 day DMA | 8.62 | | 12 day DMA | 8.48 | | 20 day DMA | 8.49 | | 35 day DMA | 8.46 | | 50 day DMA | 8.46 | | 100 day DMA | 8.51 | | 150 day DMA | 8.2 | | 200 day DMA | 7.71 | EMA (exponential moving average) of Yext Inc YEXT
| EMA period | EMA current | EMA prev | EMA prev2 | | 5 day EMA | 8.68 | 8.59 | 8.47 | | 12 day EMA | 8.56 | 8.5 | 8.44 | | 20 day EMA | 8.51 | 8.47 | 8.43 | | 35 day EMA | 8.52 | 8.5 | 8.48 | | 50 day EMA | 8.5 | 8.49 | 8.48 |
SMA (simple moving average) of Yext Inc YEXT
| SMA period | SMA current | SMA prev | SMA prev2 | | 5 day SMA | 8.62 | 8.53 | 8.46 | | 12 day SMA | 8.48 | 8.43 | 8.4 | | 20 day SMA | 8.49 | 8.47 | 8.45 | | 35 day SMA | 8.46 | 8.45 | 8.44 | | 50 day SMA | 8.46 | 8.46 | 8.46 | | 100 day SMA | 8.51 | 8.5 | 8.5 | | 150 day SMA | 8.2 | 8.19 | 8.18 | | 200 day SMA | 7.71 | 7.7 | 7.69 |
|
|
