XencorInc XNCR full analysis,charts,indicators,moving averages,SMA,DMA,EMA,ADX,MACD,RSIXencor Inc XNCR WideScreen charts, DMA,SMA,EMA technical analysis, forecast prediction, by indicators ADX,MACD,RSI,CCI USA stock exchange
operates under Health Care sector & deals in Major Pharmaceuticals
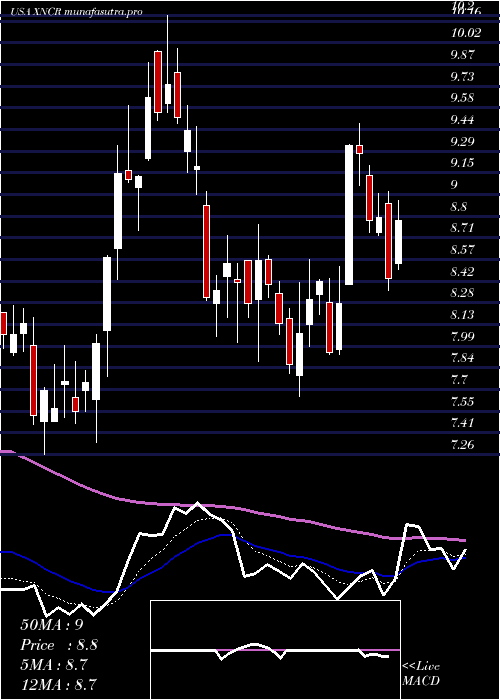
Daily price and charts and targets XencorInc Strong Daily Stock price targets for XencorInc XNCR are 17.58 and 19.24 | Daily Target 1 | 16.29 | | Daily Target 2 | 17.21 | | Daily Target 3 | 17.946666666667 | | Daily Target 4 | 18.87 | | Daily Target 5 | 19.61 |
Daily price and volume Xencor Inc
| Date |
Closing |
Open |
Range |
Volume |
Thu 04 December 2025 |
18.14 (4.79%) |
17.50 |
17.02 - 18.68 |
1.4224 times |
Wed 03 December 2025 |
17.31 (8.26%) |
16.03 |
16.03 - 17.33 |
0.7898 times |
Tue 02 December 2025 |
15.99 (-3.15%) |
16.56 |
15.69 - 16.71 |
0.861 times |
Mon 01 December 2025 |
16.51 (-4.68%) |
17.00 |
16.41 - 17.01 |
0.743 times |
Fri 28 November 2025 |
17.32 (-0.35%) |
17.53 |
17.21 - 17.83 |
0.3202 times |
Wed 26 November 2025 |
17.38 (0.7%) |
17.36 |
17.14 - 17.80 |
1.8413 times |
Tue 25 November 2025 |
17.26 (3.11%) |
16.94 |
16.78 - 17.55 |
1.2162 times |
Mon 24 November 2025 |
16.74 (5.48%) |
16.15 |
16.01 - 17.07 |
1.0446 times |
Fri 21 November 2025 |
15.87 (1.86%) |
15.61 |
15.38 - 16.22 |
0.9395 times |
Thu 20 November 2025 |
15.58 (-1.2%) |
15.99 |
15.42 - 16.63 |
0.8221 times |
Wed 19 November 2025 |
15.77 (-1.56%) |
16.02 |
15.66 - 16.24 |
0.9963 times |
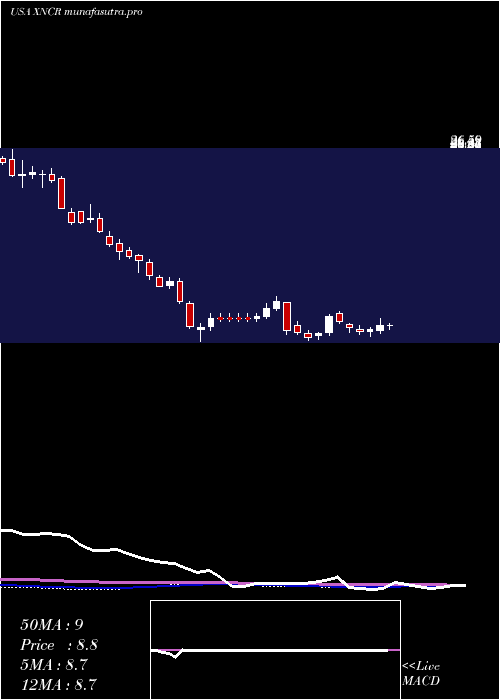
Weekly price and charts XencorInc Strong weekly Stock price targets for XencorInc XNCR are 16.92 and 19.91 | Weekly Target 1 | 14.51 | | Weekly Target 2 | 16.33 | | Weekly Target 3 | 17.503333333333 | | Weekly Target 4 | 19.32 | | Weekly Target 5 | 20.49 |
Weekly price and volumes for Xencor Inc
| Date |
Closing |
Open |
Range |
Volume |
Thu 04 December 2025 |
18.14 (4.73%) |
17.00 |
15.69 - 18.68 |
0.5342 times |
Fri 28 November 2025 |
17.32 (9.14%) |
16.15 |
16.01 - 17.83 |
0.619 times |
Fri 21 November 2025 |
15.87 (6.3%) |
14.90 |
14.72 - 16.63 |
0.8623 times |
Fri 14 November 2025 |
14.93 (7.41%) |
14.34 |
13.57 - 15.29 |
0.7317 times |
Fri 07 November 2025 |
13.90 (-5.51%) |
13.55 |
13.12 - 15.16 |
0.832 times |
Fri 31 October 2025 |
14.71 (0%) |
14.13 |
13.80 - 14.85 |
0.2535 times |
Fri 31 October 2025 |
14.71 (11.36%) |
13.72 |
13.50 - 15.50 |
1.4191 times |
Fri 24 October 2025 |
13.21 (-10.56%) |
14.80 |
12.16 - 15.69 |
1.5079 times |
Fri 17 October 2025 |
14.77 (13.35%) |
13.13 |
11.17 - 15.37 |
2.1975 times |
Fri 10 October 2025 |
13.03 (10.71%) |
11.99 |
11.36 - 13.14 |
1.0429 times |
Fri 03 October 2025 |
11.77 (1.73%) |
11.59 |
11.20 - 12.12 |
0.9578 times |
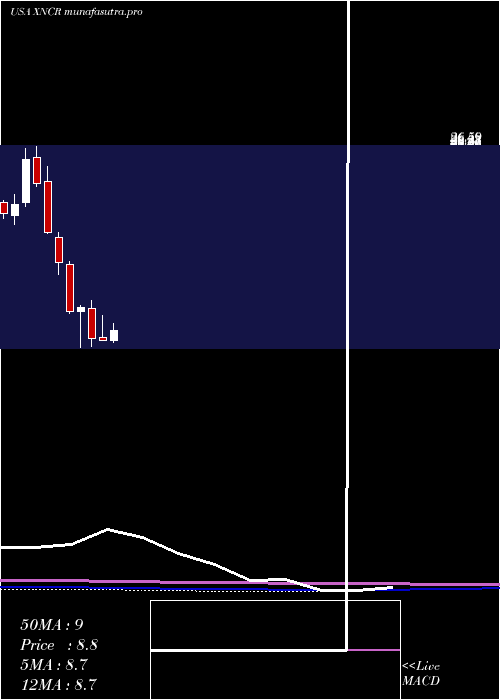
Monthly price and charts XencorInc Strong monthly Stock price targets for XencorInc XNCR are 16.92 and 19.91 | Monthly Target 1 | 14.51 | | Monthly Target 2 | 16.33 | | Monthly Target 3 | 17.503333333333 | | Monthly Target 4 | 19.32 | | Monthly Target 5 | 20.49 |
Monthly price and volumes Xencor Inc
| Date |
Closing |
Open |
Range |
Volume |
Thu 04 December 2025 |
18.14 (4.73%) |
17.00 |
15.69 - 18.68 |
0.1448 times |
Fri 28 November 2025 |
17.32 (17.74%) |
13.55 |
13.12 - 17.83 |
0.8257 times |
Fri 31 October 2025 |
14.71 (25.4%) |
11.64 |
11.17 - 15.69 |
1.8667 times |
Tue 30 September 2025 |
11.73 (44.28%) |
8.14 |
7.91 - 11.88 |
1.4287 times |
Fri 29 August 2025 |
8.13 (-2.28%) |
8.20 |
6.92 - 8.80 |
0.9047 times |
Thu 31 July 2025 |
8.32 (5.85%) |
7.79 |
7.65 - 10.06 |
0.7344 times |
Mon 30 June 2025 |
7.86 (-1.75%) |
8.09 |
7.78 - 10.20 |
0.9227 times |
Fri 30 May 2025 |
8.00 (-27.4%) |
10.95 |
7.26 - 11.70 |
1.3314 times |
Wed 30 April 2025 |
11.02 (3.57%) |
10.59 |
7.16 - 11.24 |
1.0199 times |
Mon 31 March 2025 |
10.64 (-30.73%) |
15.14 |
10.40 - 15.46 |
0.8209 times |
Fri 28 February 2025 |
15.36 (-15.97%) |
17.83 |
14.18 - 18.29 |
0.5462 times |
DMA SMA EMA moving averages of Xencor Inc XNCR
DMA (daily moving average) of Xencor Inc XNCR
| DMA period | DMA value | | 5 day DMA | 17.05 | | 12 day DMA | 16.66 | | 20 day DMA | 15.77 | | 35 day DMA | 15.09 | | 50 day DMA | 14.23 | | 100 day DMA | 11.36 | | 150 day DMA | 10.45 | | 200 day DMA | 10.74 | EMA (exponential moving average) of Xencor Inc XNCR
| EMA period | EMA current | EMA prev | EMA prev2 | | 5 day EMA | 17.23 | 16.78 | 16.52 | | 12 day EMA | 16.63 | 16.35 | 16.17 | | 20 day EMA | 16.03 | 15.81 | 15.65 | | 35 day EMA | 15.09 | 14.91 | 14.77 | | 50 day EMA | 14.2 | 14.04 | 13.91 |
SMA (simple moving average) of Xencor Inc XNCR
| SMA period | SMA current | SMA prev | SMA prev2 | | 5 day SMA | 17.05 | 16.9 | 16.89 | | 12 day SMA | 16.66 | 16.45 | 16.25 | | 20 day SMA | 15.77 | 15.58 | 15.4 | | 35 day SMA | 15.09 | 14.98 | 14.84 | | 50 day SMA | 14.23 | 14.08 | 13.94 | | 100 day SMA | 11.36 | 11.27 | 11.18 | | 150 day SMA | 10.45 | 10.4 | 10.36 | | 200 day SMA | 10.74 | 10.73 | 10.73 |
|
|
