XcelBrands XELB full analysis,charts,indicators,moving averages,SMA,DMA,EMA,ADX,MACD,RSIXcel Brands XELB WideScreen charts, DMA,SMA,EMA technical analysis, forecast prediction, by indicators ADX,MACD,RSI,CCI USA stock exchange
operates under Miscellaneous sector & deals in Multi Sector Companies
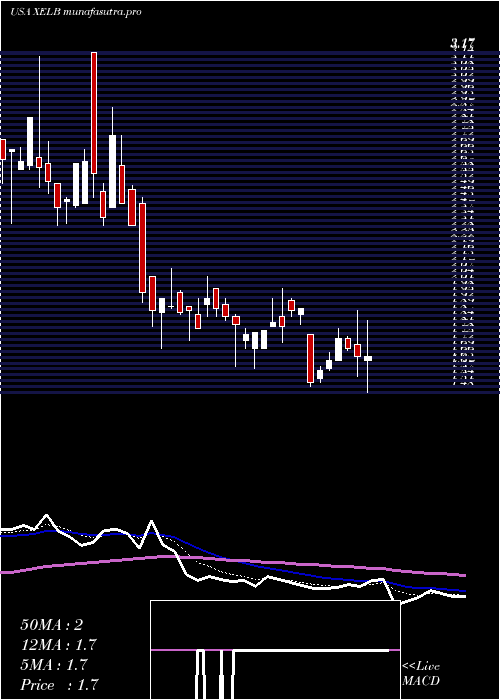
Daily price and charts and targets XcelBrands Strong Daily Stock price targets for XcelBrands XELB are 0.91 and 0.95 | Daily Target 1 | 0.9 | | Daily Target 2 | 0.91 | | Daily Target 3 | 0.93666666666667 | | Daily Target 4 | 0.95 | | Daily Target 5 | 0.98 |
Daily price and volume Xcel Brands
| Date |
Closing |
Open |
Range |
Volume |
Thu 04 December 2025 |
0.93 (-1.06%) |
0.94 |
0.92 - 0.96 |
0.1397 times |
Wed 03 December 2025 |
0.94 (-1.05%) |
0.94 |
0.93 - 0.96 |
0.0726 times |
Tue 02 December 2025 |
0.95 (-1.04%) |
0.96 |
0.91 - 0.96 |
0.3184 times |
Mon 01 December 2025 |
0.96 (2.13%) |
0.94 |
0.91 - 0.96 |
0.2318 times |
Fri 28 November 2025 |
0.94 (3.3%) |
0.93 |
0.93 - 0.98 |
0.2849 times |
Wed 26 November 2025 |
0.91 (-7.14%) |
0.96 |
0.91 - 1.00 |
1.1425 times |
Tue 25 November 2025 |
0.98 (4.26%) |
0.99 |
0.94 - 1.02 |
3.1229 times |
Mon 24 November 2025 |
0.94 (13.25%) |
0.83 |
0.82 - 0.99 |
1.8212 times |
Fri 21 November 2025 |
0.83 (10.67%) |
0.77 |
0.77 - 0.85 |
1.0419 times |
Thu 20 November 2025 |
0.75 (-6.25%) |
0.80 |
0.74 - 0.84 |
1.824 times |
Wed 19 November 2025 |
0.80 (-4.76%) |
0.84 |
0.78 - 0.86 |
1.4721 times |
Weekly price and charts XcelBrands Strong weekly Stock price targets for XcelBrands XELB are 0.9 and 0.95 | Weekly Target 1 | 0.88 | | Weekly Target 2 | 0.91 | | Weekly Target 3 | 0.93333333333333 | | Weekly Target 4 | 0.96 | | Weekly Target 5 | 0.98 |
Weekly price and volumes for Xcel Brands
| Date |
Closing |
Open |
Range |
Volume |
Thu 04 December 2025 |
0.93 (-1.06%) |
0.94 |
0.91 - 0.96 |
0.0577 times |
Fri 28 November 2025 |
0.94 (13.25%) |
0.83 |
0.82 - 1.02 |
0.4822 times |
Fri 21 November 2025 |
0.83 (-2.35%) |
0.86 |
0.74 - 0.91 |
0.5175 times |
Fri 14 November 2025 |
0.85 (-22.02%) |
1.05 |
0.84 - 1.12 |
0.4887 times |
Fri 07 November 2025 |
1.09 (-13.49%) |
1.20 |
1.04 - 1.20 |
0.2412 times |
Fri 31 October 2025 |
1.26 (0%) |
1.24 |
1.19 - 1.26 |
0.0539 times |
Fri 31 October 2025 |
1.26 (-9.35%) |
1.41 |
1.17 - 1.41 |
0.9713 times |
Fri 24 October 2025 |
1.39 (-26.06%) |
1.95 |
1.34 - 1.95 |
1.2755 times |
Fri 17 October 2025 |
1.88 (-5.05%) |
2.09 |
1.83 - 2.27 |
1.1136 times |
Fri 10 October 2025 |
1.98 (-5.71%) |
2.05 |
1.85 - 2.30 |
4.7984 times |
Fri 03 October 2025 |
2.10 (19.32%) |
1.77 |
1.67 - 3.16 |
84.204 times |
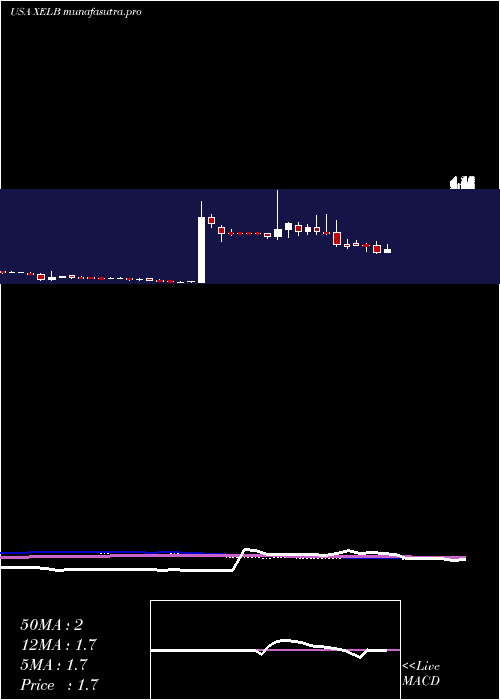
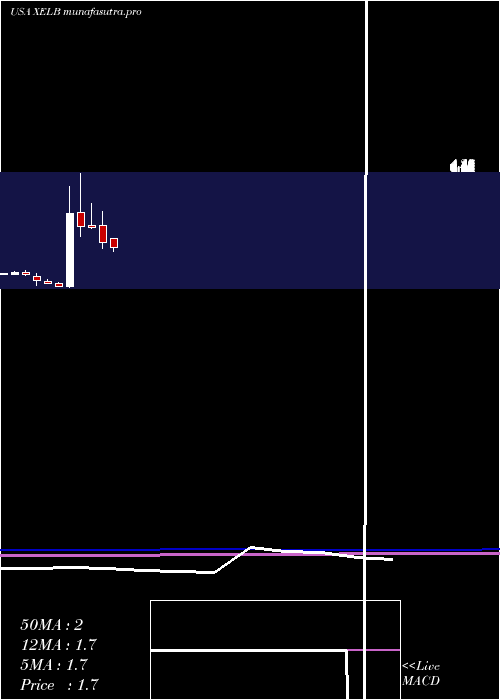
Monthly price and charts XcelBrands Strong monthly Stock price targets for XcelBrands XELB are 0.9 and 0.95 | Monthly Target 1 | 0.88 | | Monthly Target 2 | 0.91 | | Monthly Target 3 | 0.93333333333333 | | Monthly Target 4 | 0.96 | | Monthly Target 5 | 0.98 |
Monthly price and volumes Xcel Brands
| Date |
Closing |
Open |
Range |
Volume |
Thu 04 December 2025 |
0.93 (-1.06%) |
0.94 |
0.91 - 0.96 |
0.003 times |
Fri 28 November 2025 |
0.94 (-25.4%) |
1.20 |
0.74 - 1.20 |
0.091 times |
Fri 31 October 2025 |
1.26 (-28.41%) |
1.72 |
1.17 - 3.16 |
4.8541 times |
Tue 30 September 2025 |
1.76 (29.41%) |
1.35 |
1.30 - 1.87 |
0.1338 times |
Fri 29 August 2025 |
1.36 (0%) |
1.05 |
0.95 - 1.43 |
3.1971 times |
Thu 31 July 2025 |
1.36 (-24.86%) |
1.94 |
1.31 - 1.95 |
0.6335 times |
Mon 30 June 2025 |
1.81 (-22.98%) |
2.40 |
1.60 - 2.90 |
0.3165 times |
Fri 30 May 2025 |
2.35 (-1.26%) |
2.42 |
2.29 - 3.17 |
0.0845 times |
Wed 30 April 2025 |
2.38 (-15.6%) |
2.87 |
2.02 - 4.20 |
0.5015 times |
Mon 31 March 2025 |
2.82 (840%) |
0.31 |
0.25 - 3.74 |
0.185 times |
Fri 28 February 2025 |
0.30 (-28.57%) |
0.42 |
0.29 - 0.45 |
0.133 times |
DMA SMA EMA moving averages of Xcel Brands XELB
DMA (daily moving average) of Xcel Brands XELB
| DMA period | DMA value | | 5 day DMA | 0.94 | | 12 day DMA | 0.9 | | 20 day DMA | 0.95 | | 35 day DMA | 1.15 | | 50 day DMA | 1.41 | | 100 day DMA | 1.39 | | 150 day DMA | 1.65 | | 200 day DMA | 1.6 | EMA (exponential moving average) of Xcel Brands XELB
| EMA period | EMA current | EMA prev | EMA prev2 | | 5 day EMA | 0.94 | 0.94 | 0.94 | | 12 day EMA | 0.94 | 0.94 | 0.94 | | 20 day EMA | 0.99 | 1 | 1.01 | | 35 day EMA | 1.18 | 1.19 | 1.2 | | 50 day EMA | 1.37 | 1.39 | 1.41 |
SMA (simple moving average) of Xcel Brands XELB
| SMA period | SMA current | SMA prev | SMA prev2 | | 5 day SMA | 0.94 | 0.94 | 0.95 | | 12 day SMA | 0.9 | 0.9 | 0.89 | | 20 day SMA | 0.95 | 0.96 | 0.97 | | 35 day SMA | 1.15 | 1.19 | 1.22 | | 50 day SMA | 1.41 | 1.43 | 1.44 | | 100 day SMA | 1.39 | 1.4 | 1.41 | | 150 day SMA | 1.65 | 1.66 | 1.67 | | 200 day SMA | 1.6 | 1.6 | 1.6 |
|
|
