WynnResorts WYNN full analysis,charts,indicators,moving averages,SMA,DMA,EMA,ADX,MACD,RSIWynn Resorts WYNN WideScreen charts, DMA,SMA,EMA technical analysis, forecast prediction, by indicators ADX,MACD,RSI,CCI USA stock exchange
operates under Consumer Services sector & deals in Hotels Resorts
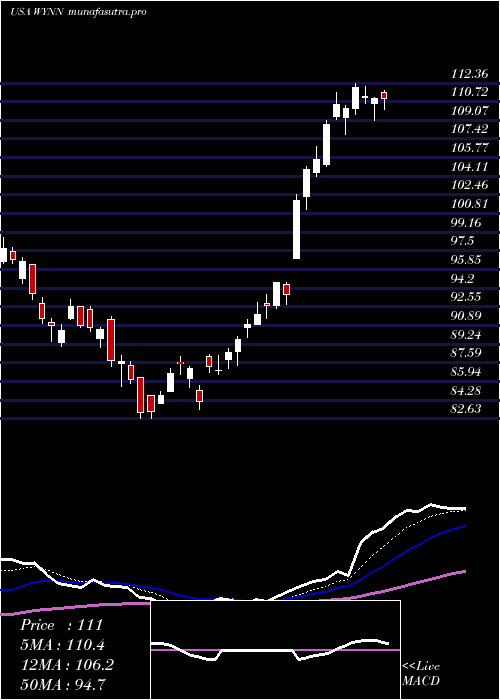
Daily price and charts and targets WynnResorts Strong Daily Stock price targets for WynnResorts WYNN are 120.99 and 123.71 | Daily Target 1 | 118.85 | | Daily Target 2 | 120.4 | | Daily Target 3 | 121.57333333333 | | Daily Target 4 | 123.12 | | Daily Target 5 | 124.29 |
Daily price and volume Wynn Resorts
| Date |
Closing |
Open |
Range |
Volume |
Mon 20 October 2025 |
121.94 (3.51%) |
120.38 |
120.03 - 122.75 |
1.1295 times |
Fri 17 October 2025 |
117.81 (1.63%) |
115.72 |
115.55 - 119.39 |
0.9571 times |
Thu 16 October 2025 |
115.92 (-1.82%) |
118.23 |
115.25 - 119.16 |
0.5553 times |
Wed 15 October 2025 |
118.07 (1.69%) |
116.92 |
116.50 - 119.51 |
0.7786 times |
Tue 14 October 2025 |
116.11 (3.19%) |
112.00 |
111.97 - 117.50 |
0.7307 times |
Mon 13 October 2025 |
112.52 (-6.15%) |
119.16 |
112.13 - 119.61 |
1.7387 times |
Fri 10 October 2025 |
119.89 (-2.96%) |
123.35 |
118.07 - 124.57 |
1.1975 times |
Thu 09 October 2025 |
123.55 (1.63%) |
121.82 |
120.76 - 124.27 |
0.8507 times |
Wed 08 October 2025 |
121.57 (-1.09%) |
122.18 |
119.86 - 125.14 |
1.2703 times |
Tue 07 October 2025 |
122.91 (-1.35%) |
124.57 |
122.30 - 125.49 |
0.7916 times |
Mon 06 October 2025 |
124.59 (-0.17%) |
124.60 |
122.82 - 126.35 |
0.9865 times |
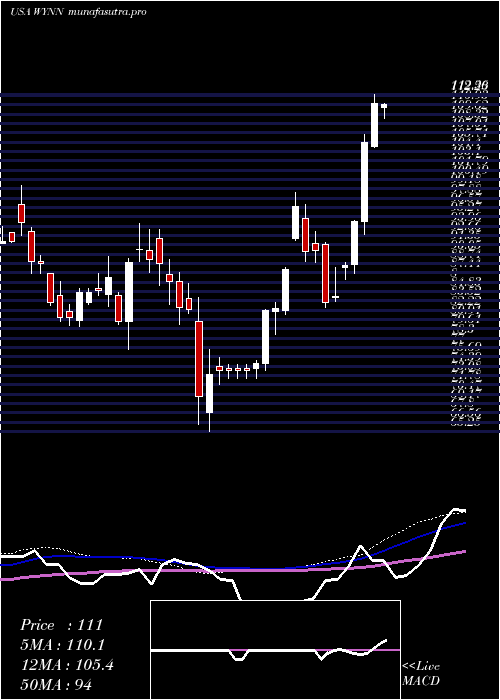
Weekly price and charts WynnResorts Strong weekly Stock price targets for WynnResorts WYNN are 120.99 and 123.71 | Weekly Target 1 | 118.85 | | Weekly Target 2 | 120.4 | | Weekly Target 3 | 121.57333333333 | | Weekly Target 4 | 123.12 | | Weekly Target 5 | 124.29 |
Weekly price and volumes for Wynn Resorts
| Date |
Closing |
Open |
Range |
Volume |
Mon 20 October 2025 |
121.94 (3.51%) |
120.38 |
120.03 - 122.75 |
0.2698 times |
Fri 17 October 2025 |
117.81 (-1.73%) |
119.16 |
111.97 - 119.61 |
1.1371 times |
Fri 10 October 2025 |
119.89 (-3.93%) |
124.60 |
118.07 - 126.35 |
1.2174 times |
Fri 03 October 2025 |
124.80 (-3.23%) |
130.17 |
123.07 - 134.23 |
1.0921 times |
Fri 26 September 2025 |
128.97 (-0.42%) |
129.52 |
124.40 - 130.54 |
0.7681 times |
Fri 19 September 2025 |
129.52 (6.64%) |
121.45 |
119.72 - 130.84 |
1.3198 times |
Fri 12 September 2025 |
121.45 (0.45%) |
121.00 |
120.00 - 124.71 |
0.9558 times |
Fri 05 September 2025 |
120.90 (-4.62%) |
125.00 |
119.99 - 127.25 |
0.9695 times |
Fri 29 August 2025 |
126.75 (0%) |
126.25 |
125.52 - 128.53 |
0.3399 times |
Fri 29 August 2025 |
126.75 (10.88%) |
115.58 |
115.00 - 128.53 |
1.9305 times |
Fri 22 August 2025 |
114.31 (4.44%) |
109.49 |
107.89 - 114.62 |
1.3957 times |
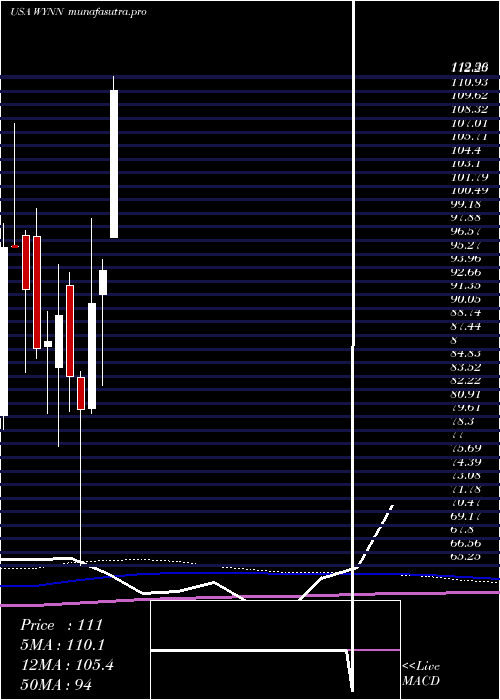
Monthly price and charts WynnResorts Strong monthly Stock price targets for WynnResorts WYNN are 105.83 and 128.09 | Monthly Target 1 | 100.45 | | Monthly Target 2 | 111.2 | | Monthly Target 3 | 122.71333333333 | | Monthly Target 4 | 133.46 | | Monthly Target 5 | 144.97 |
Monthly price and volumes Wynn Resorts
| Date |
Closing |
Open |
Range |
Volume |
Mon 20 October 2025 |
121.94 (-4.93%) |
128.37 |
111.97 - 134.23 |
0.5417 times |
Tue 30 September 2025 |
128.27 (1.2%) |
125.00 |
119.72 - 134.07 |
0.7448 times |
Fri 29 August 2025 |
126.75 (16.25%) |
110.00 |
102.24 - 128.53 |
1.0279 times |
Thu 31 July 2025 |
109.03 (16.4%) |
96.86 |
96.86 - 112.36 |
0.9345 times |
Mon 30 June 2025 |
93.67 (3.46%) |
91.41 |
82.63 - 94.73 |
0.8868 times |
Fri 30 May 2025 |
90.54 (12.74%) |
80.44 |
79.92 - 98.71 |
1.2111 times |
Wed 30 April 2025 |
80.31 (-3.82%) |
83.35 |
65.25 - 83.99 |
1.3284 times |
Mon 31 March 2025 |
83.50 (-6.52%) |
92.25 |
80.16 - 93.52 |
0.8243 times |
Fri 28 February 2025 |
89.32 (2.84%) |
84.32 |
76.75 - 94.29 |
1.3565 times |
Fri 31 January 2025 |
86.85 (0.8%) |
86.33 |
79.90 - 89.75 |
1.1442 times |
Tue 31 December 2024 |
86.16 (-6.21%) |
97.00 |
85.24 - 99.62 |
0.58 times |
DMA SMA EMA moving averages of Wynn Resorts WYNN
DMA (daily moving average) of Wynn Resorts WYNN
| DMA period | DMA value | | 5 day DMA | 117.97 | | 12 day DMA | 119.97 | | 20 day DMA | 123.7 | | 35 day DMA | 123.78 | | 50 day DMA | 121.52 | | 100 day DMA | 110.59 | | 150 day DMA | 101.16 | | 200 day DMA | 97.21 | EMA (exponential moving average) of Wynn Resorts WYNN
| EMA period | EMA current | EMA prev | EMA prev2 | | 5 day EMA | 119.02 | 117.56 | 117.44 | | 12 day EMA | 120.32 | 120.02 | 120.42 | | 20 day EMA | 121.42 | 121.37 | 121.75 | | 35 day EMA | 121 | 120.94 | 121.12 | | 50 day EMA | 120.03 | 119.95 | 120.04 |
SMA (simple moving average) of Wynn Resorts WYNN
| SMA period | SMA current | SMA prev | SMA prev2 | | 5 day SMA | 117.97 | 116.09 | 116.5 | | 12 day SMA | 119.97 | 120.92 | 122.11 | | 20 day SMA | 123.7 | 123.91 | 124.49 | | 35 day SMA | 123.78 | 123.91 | 124.17 | | 50 day SMA | 121.52 | 121.25 | 121.02 | | 100 day SMA | 110.59 | 110.3 | 110.03 | | 150 day SMA | 101.16 | 100.92 | 100.69 | | 200 day SMA | 97.21 | 97.02 | 96.86 |
|
|
