WattsWater WTS full analysis,charts,indicators,moving averages,SMA,DMA,EMA,ADX,MACD,RSIWatts Water WTS WideScreen charts, DMA,SMA,EMA technical analysis, forecast prediction, by indicators ADX,MACD,RSI,CCI USA stock exchange
operates under Capital Goods sector & deals in Metal Fabrications
Daily price and charts and targets WattsWater Strong Daily Stock price targets for WattsWater WTS are 278.94 and 286.56 | Daily Target 1 | 272.96 | | Daily Target 2 | 277.29 | | Daily Target 3 | 280.58333333333 | | Daily Target 4 | 284.91 | | Daily Target 5 | 288.2 |
Daily price and volume Watts Water
| Date |
Closing |
Open |
Range |
Volume |
Tue 21 October 2025 |
281.61 (-0.01%) |
280.12 |
276.26 - 283.88 |
0.7476 times |
Mon 20 October 2025 |
281.65 (2.17%) |
276.96 |
276.33 - 281.69 |
1.0654 times |
Fri 17 October 2025 |
275.68 (-0.14%) |
275.87 |
274.16 - 277.00 |
0.9093 times |
Thu 16 October 2025 |
276.07 (-0.61%) |
279.57 |
273.58 - 280.00 |
0.8069 times |
Wed 15 October 2025 |
277.77 (1.18%) |
276.13 |
269.10 - 278.68 |
0.8141 times |
Tue 14 October 2025 |
274.54 (1.22%) |
267.62 |
267.62 - 275.11 |
0.8421 times |
Mon 13 October 2025 |
271.24 (1.47%) |
270.18 |
268.04 - 273.89 |
1.3215 times |
Fri 10 October 2025 |
267.32 (-2.32%) |
274.38 |
265.98 - 276.00 |
1.6633 times |
Thu 09 October 2025 |
273.68 (-2.39%) |
280.10 |
273.27 - 280.10 |
1.0302 times |
Wed 08 October 2025 |
280.37 (0.84%) |
279.21 |
277.13 - 280.79 |
0.7996 times |
Tue 07 October 2025 |
278.03 (-1.72%) |
283.06 |
276.65 - 283.95 |
1.0518 times |
Weekly price and charts WattsWater Strong weekly Stock price targets for WattsWater WTS are 278.94 and 286.56 | Weekly Target 1 | 272.96 | | Weekly Target 2 | 277.29 | | Weekly Target 3 | 280.58333333333 | | Weekly Target 4 | 284.91 | | Weekly Target 5 | 288.2 |
Weekly price and volumes for Watts Water
| Date |
Closing |
Open |
Range |
Volume |
Tue 21 October 2025 |
281.61 (2.15%) |
276.96 |
276.26 - 283.88 |
0.3474 times |
Fri 17 October 2025 |
275.68 (3.13%) |
270.18 |
267.62 - 280.00 |
0.8993 times |
Fri 10 October 2025 |
267.32 (-5.32%) |
285.35 |
265.98 - 287.09 |
0.9481 times |
Fri 03 October 2025 |
282.34 (1.41%) |
279.00 |
275.00 - 283.22 |
0.9081 times |
Fri 26 September 2025 |
278.41 (-0.9%) |
280.40 |
273.86 - 283.60 |
1.083 times |
Fri 19 September 2025 |
280.94 (-0.18%) |
281.82 |
278.96 - 287.89 |
1.7154 times |
Fri 12 September 2025 |
281.44 (0.4%) |
280.67 |
275.26 - 285.01 |
1.0873 times |
Fri 05 September 2025 |
280.31 (1.23%) |
273.39 |
273.39 - 282.69 |
0.935 times |
Fri 29 August 2025 |
276.90 (0%) |
282.78 |
275.02 - 282.78 |
0.471 times |
Fri 29 August 2025 |
276.90 (-1.31%) |
279.23 |
275.02 - 285.90 |
1.6054 times |
Fri 22 August 2025 |
280.57 (3.55%) |
271.00 |
270.90 - 281.60 |
1.2999 times |
Monthly price and charts WattsWater Strong monthly Stock price targets for WattsWater WTS are 273.8 and 294.91 | Monthly Target 1 | 257.12 | | Monthly Target 2 | 269.36 | | Monthly Target 3 | 278.22666666667 | | Monthly Target 4 | 290.47 | | Monthly Target 5 | 299.34 |
Monthly price and volumes Watts Water
| Date |
Closing |
Open |
Range |
Volume |
Tue 21 October 2025 |
281.61 (0.83%) |
275.24 |
265.98 - 287.09 |
0.4671 times |
Tue 30 September 2025 |
279.28 (0.86%) |
273.39 |
273.39 - 287.89 |
0.8901 times |
Fri 29 August 2025 |
276.90 (5.56%) |
260.02 |
251.17 - 285.90 |
1.374 times |
Thu 31 July 2025 |
262.32 (6.68%) |
244.77 |
242.77 - 263.07 |
1.1149 times |
Mon 30 June 2025 |
245.89 (1.56%) |
240.27 |
237.15 - 249.51 |
0.9077 times |
Fri 30 May 2025 |
242.12 (16.54%) |
208.22 |
206.74 - 248.17 |
1.2203 times |
Wed 30 April 2025 |
207.75 (1.88%) |
202.88 |
177.59 - 210.60 |
1.0973 times |
Mon 31 March 2025 |
203.92 (-4.97%) |
215.21 |
202.00 - 217.60 |
1.1281 times |
Fri 28 February 2025 |
214.58 (3.77%) |
203.50 |
198.85 - 232.60 |
1.071 times |
Fri 31 January 2025 |
206.78 (1.71%) |
203.75 |
193.79 - 213.70 |
0.7295 times |
Tue 31 December 2024 |
203.30 (-5.38%) |
213.69 |
200.29 - 222.70 |
0.7612 times |

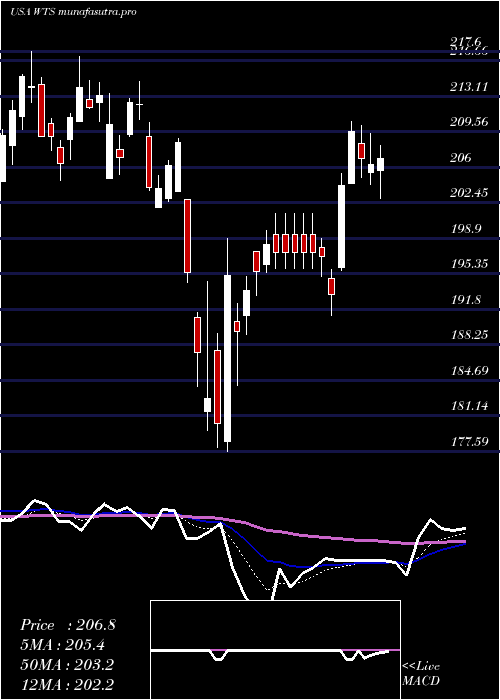
DMA SMA EMA moving averages of Watts Water WTS
DMA (daily moving average) of Watts Water WTS
| DMA period | DMA value | | 5 day DMA | 278.56 | | 12 day DMA | 276.74 | | 20 day DMA | 277.36 | | 35 day DMA | 278.74 | | 50 day DMA | 278.44 | | 100 day DMA | 264.38 | | 150 day DMA | 247.28 | | 200 day DMA | 237.96 | EMA (exponential moving average) of Watts Water WTS
| EMA period | EMA current | EMA prev | EMA prev2 | | 5 day EMA | 278.91 | 277.56 | 275.51 | | 12 day EMA | 277.68 | 276.97 | 276.12 | | 20 day EMA | 277.65 | 277.23 | 276.77 | | 35 day EMA | 277.28 | 277.02 | 276.75 | | 50 day EMA | 277.39 | 277.22 | 277.04 |
SMA (simple moving average) of Watts Water WTS
| SMA period | SMA current | SMA prev | SMA prev2 | | 5 day SMA | 278.56 | 277.14 | 275.06 | | 12 day SMA | 276.74 | 276.8 | 276.72 | | 20 day SMA | 277.36 | 277.25 | 277.17 | | 35 day SMA | 278.74 | 278.63 | 278.49 | | 50 day SMA | 278.44 | 278.26 | 277.97 | | 100 day SMA | 264.38 | 263.97 | 263.6 | | 150 day SMA | 247.28 | 246.81 | 246.36 | | 200 day SMA | 237.96 | 237.56 | 237.17 |
|
|
