WTfshore WTI full analysis,charts,indicators,moving averages,SMA,DMA,EMA,ADX,MACD,RSIW Tfshore WTI WideScreen charts, DMA,SMA,EMA technical analysis, forecast prediction, by indicators ADX,MACD,RSI,CCI USA stock exchange
operates under Energy sector & deals in Oil Gas Production
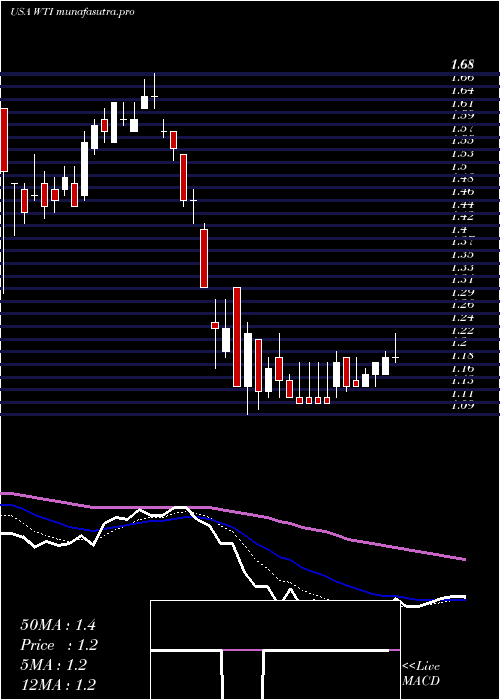
Daily price and charts and targets WTfshore Strong Daily Stock price targets for WTfshore WTI are 1.79 and 1.88 | Daily Target 1 | 1.72 | | Daily Target 2 | 1.76 | | Daily Target 3 | 1.81 | | Daily Target 4 | 1.85 | | Daily Target 5 | 1.9 |
Daily price and volume W Tfshore
| Date |
Closing |
Open |
Range |
Volume |
Thu 04 December 2025 |
1.80 (0.56%) |
1.77 |
1.77 - 1.86 |
0.8624 times |
Wed 03 December 2025 |
1.79 (9.15%) |
1.67 |
1.67 - 1.81 |
1.356 times |
Tue 02 December 2025 |
1.64 (-2.96%) |
1.71 |
1.64 - 1.71 |
1.5011 times |
Mon 01 December 2025 |
1.69 (-4.52%) |
1.78 |
1.69 - 1.80 |
1.3914 times |
Fri 28 November 2025 |
1.77 (1.14%) |
1.78 |
1.76 - 1.82 |
0.6956 times |
Wed 26 November 2025 |
1.75 (-1.69%) |
1.80 |
1.75 - 1.82 |
0.6507 times |
Tue 25 November 2025 |
1.78 (-1.11%) |
1.72 |
1.72 - 1.82 |
0.4284 times |
Mon 24 November 2025 |
1.80 (-3.23%) |
1.83 |
1.78 - 1.89 |
0.8776 times |
Fri 21 November 2025 |
1.86 (-1.59%) |
1.88 |
1.81 - 1.88 |
1.1292 times |
Thu 20 November 2025 |
1.89 (0.53%) |
1.88 |
1.87 - 1.97 |
1.1076 times |
Wed 19 November 2025 |
1.88 (-3.09%) |
1.88 |
1.86 - 1.90 |
0.7718 times |
Weekly price and charts WTfshore Strong weekly Stock price targets for WTfshore WTI are 1.72 and 1.94 | Weekly Target 1 | 1.55 | | Weekly Target 2 | 1.67 | | Weekly Target 3 | 1.7666666666667 | | Weekly Target 4 | 1.89 | | Weekly Target 5 | 1.99 |
Weekly price and volumes for W Tfshore
| Date |
Closing |
Open |
Range |
Volume |
Thu 04 December 2025 |
1.80 (1.69%) |
1.78 |
1.64 - 1.86 |
0.816 times |
Fri 28 November 2025 |
1.77 (-4.84%) |
1.83 |
1.72 - 1.89 |
0.4235 times |
Fri 21 November 2025 |
1.86 (-3.12%) |
1.93 |
1.80 - 1.97 |
0.6859 times |
Fri 14 November 2025 |
1.92 (-5.88%) |
2.06 |
1.86 - 2.06 |
0.8781 times |
Fri 07 November 2025 |
2.04 (-2.86%) |
2.03 |
1.83 - 2.08 |
0.8311 times |
Fri 31 October 2025 |
2.10 (0%) |
2.08 |
2.05 - 2.11 |
0.1172 times |
Fri 31 October 2025 |
2.10 (-7.08%) |
2.29 |
2.05 - 2.30 |
0.7589 times |
Fri 24 October 2025 |
2.26 (8.13%) |
2.12 |
2.01 - 2.34 |
0.9586 times |
Fri 17 October 2025 |
2.09 (0.97%) |
2.14 |
2.06 - 2.59 |
2.2222 times |
Fri 10 October 2025 |
2.07 (5.08%) |
1.92 |
1.92 - 2.36 |
2.3086 times |
Fri 03 October 2025 |
1.97 (-4.37%) |
2.04 |
1.77 - 2.05 |
1.0618 times |
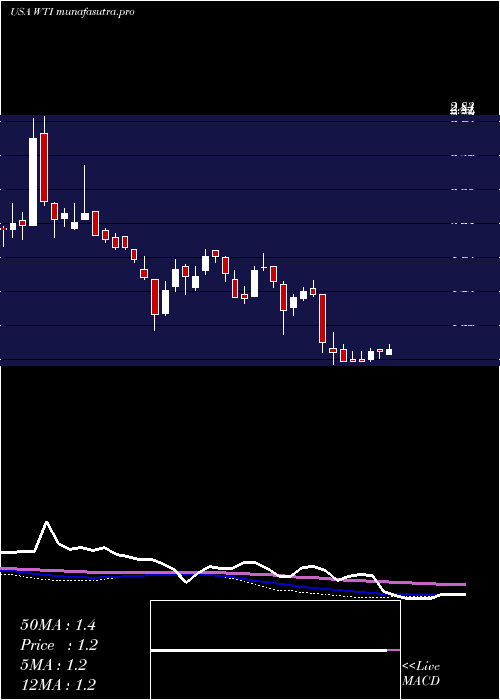
Monthly price and charts WTfshore Strong monthly Stock price targets for WTfshore WTI are 1.72 and 1.94 | Monthly Target 1 | 1.55 | | Monthly Target 2 | 1.67 | | Monthly Target 3 | 1.7666666666667 | | Monthly Target 4 | 1.89 | | Monthly Target 5 | 1.99 |
Monthly price and volumes W Tfshore
| Date |
Closing |
Open |
Range |
Volume |
Thu 04 December 2025 |
1.80 (1.69%) |
1.78 |
1.64 - 1.86 |
0.2009 times |
Fri 28 November 2025 |
1.77 (-15.71%) |
2.03 |
1.72 - 2.08 |
0.6941 times |
Fri 31 October 2025 |
2.10 (15.38%) |
1.80 |
1.77 - 2.59 |
1.6951 times |
Tue 30 September 2025 |
1.82 (0%) |
1.81 |
1.71 - 2.09 |
0.9085 times |
Fri 29 August 2025 |
1.82 (2.82%) |
1.76 |
1.65 - 1.87 |
0.6607 times |
Thu 31 July 2025 |
1.77 (7.27%) |
1.67 |
1.62 - 1.88 |
1.0557 times |
Mon 30 June 2025 |
1.65 (11.49%) |
1.53 |
1.50 - 2.49 |
2.1788 times |
Fri 30 May 2025 |
1.48 (28.7%) |
1.14 |
1.14 - 1.60 |
0.8817 times |
Wed 30 April 2025 |
1.15 (-25.81%) |
1.54 |
1.09 - 1.54 |
0.9348 times |
Mon 31 March 2025 |
1.55 (-7.19%) |
1.65 |
1.30 - 1.68 |
0.7896 times |
Fri 28 February 2025 |
1.67 (7.05%) |
1.58 |
1.52 - 1.87 |
0.5663 times |

DMA SMA EMA moving averages of W Tfshore WTI
DMA (daily moving average) of W Tfshore WTI
| DMA period | DMA value | | 5 day DMA | 1.74 | | 12 day DMA | 1.8 | | 20 day DMA | 1.85 | | 35 day DMA | 1.96 | | 50 day DMA | 2 | | 100 day DMA | 1.88 | | 150 day DMA | 1.8 | | 200 day DMA | 1.7 | EMA (exponential moving average) of W Tfshore WTI
| EMA period | EMA current | EMA prev | EMA prev2 | | 5 day EMA | 1.76 | 1.74 | 1.72 | | 12 day EMA | 1.8 | 1.8 | 1.8 | | 20 day EMA | 1.84 | 1.84 | 1.85 | | 35 day EMA | 1.88 | 1.89 | 1.9 | | 50 day EMA | 1.96 | 1.97 | 1.98 |
SMA (simple moving average) of W Tfshore WTI
| SMA period | SMA current | SMA prev | SMA prev2 | | 5 day SMA | 1.74 | 1.73 | 1.73 | | 12 day SMA | 1.8 | 1.81 | 1.82 | | 20 day SMA | 1.85 | 1.86 | 1.87 | | 35 day SMA | 1.96 | 1.98 | 1.99 | | 50 day SMA | 2 | 2.01 | 2.01 | | 100 day SMA | 1.88 | 1.88 | 1.88 | | 150 day SMA | 1.8 | 1.8 | 1.79 | | 200 day SMA | 1.7 | 1.7 | 1.7 |
|
|
