WintrustFinancial WTFC full analysis,charts,indicators,moving averages,SMA,DMA,EMA,ADX,MACD,RSIWintrust Financial WTFC WideScreen charts, DMA,SMA,EMA technical analysis, forecast prediction, by indicators ADX,MACD,RSI,CCI USA stock exchange
operates under Finance sector & deals in Major Banks
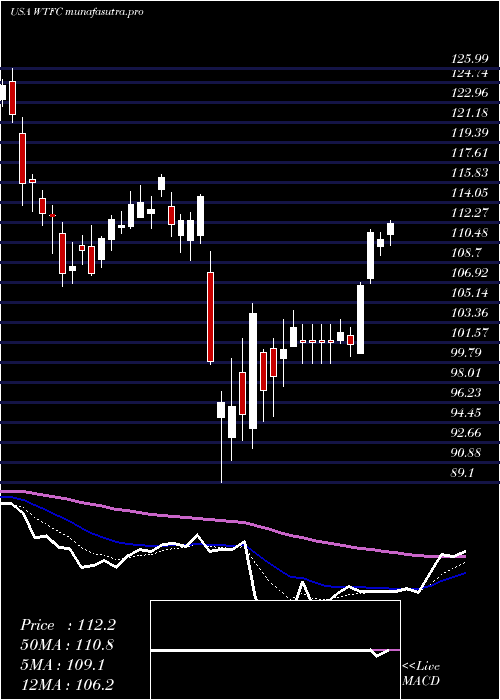
Daily price and charts and targets WintrustFinancial Strong Daily Stock price targets for WintrustFinancial WTFC are 124.89 and 128.99 | Daily Target 1 | 121.59 | | Daily Target 2 | 124.09 | | Daily Target 3 | 125.69333333333 | | Daily Target 4 | 128.19 | | Daily Target 5 | 129.79 |
Daily price and volume Wintrust Financial
| Date |
Closing |
Open |
Range |
Volume |
Mon 20 October 2025 |
126.58 (2.99%) |
123.21 |
123.20 - 127.30 |
0.5485 times |
Fri 17 October 2025 |
122.90 (2.21%) |
119.63 |
119.63 - 123.18 |
0.9923 times |
Thu 16 October 2025 |
120.24 (-6.1%) |
127.38 |
119.61 - 127.38 |
2.3344 times |
Wed 15 October 2025 |
128.05 (-2.77%) |
132.26 |
127.53 - 132.26 |
0.8583 times |
Tue 14 October 2025 |
131.70 (2.55%) |
127.94 |
127.34 - 132.56 |
0.767 times |
Mon 13 October 2025 |
128.43 (2.33%) |
126.52 |
126.51 - 129.28 |
1.0101 times |
Fri 10 October 2025 |
125.51 (-4.5%) |
131.86 |
125.48 - 132.55 |
1.1837 times |
Thu 09 October 2025 |
131.42 (-0.14%) |
131.73 |
130.27 - 132.29 |
0.8508 times |
Wed 08 October 2025 |
131.61 (-0.05%) |
132.68 |
131.00 - 132.86 |
0.7338 times |
Tue 07 October 2025 |
131.67 (-0.73%) |
132.88 |
130.85 - 134.00 |
0.7212 times |
Mon 06 October 2025 |
132.64 (1.72%) |
131.20 |
131.17 - 135.37 |
1.3456 times |
Weekly price and charts WintrustFinancial Strong weekly Stock price targets for WintrustFinancial WTFC are 124.89 and 128.99 | Weekly Target 1 | 121.59 | | Weekly Target 2 | 124.09 | | Weekly Target 3 | 125.69333333333 | | Weekly Target 4 | 128.19 | | Weekly Target 5 | 129.79 |
Weekly price and volumes for Wintrust Financial
| Date |
Closing |
Open |
Range |
Volume |
Mon 20 October 2025 |
126.58 (2.99%) |
123.21 |
123.20 - 127.30 |
0.143 times |
Fri 17 October 2025 |
122.90 (-2.08%) |
126.52 |
119.61 - 132.56 |
1.5547 times |
Fri 10 October 2025 |
125.51 (-3.75%) |
131.20 |
125.48 - 135.37 |
1.2608 times |
Fri 03 October 2025 |
130.40 (-2.72%) |
134.82 |
129.30 - 134.99 |
1.1458 times |
Fri 26 September 2025 |
134.04 (-0.77%) |
134.73 |
130.57 - 136.22 |
0.9654 times |
Fri 19 September 2025 |
135.08 (-0.37%) |
136.02 |
131.46 - 137.47 |
1.3758 times |
Fri 12 September 2025 |
135.58 (-2.83%) |
139.67 |
134.55 - 139.67 |
1.0327 times |
Fri 05 September 2025 |
139.53 (1.63%) |
135.46 |
134.86 - 141.69 |
0.8145 times |
Fri 29 August 2025 |
137.29 (0%) |
138.17 |
136.71 - 138.92 |
0.3248 times |
Fri 29 August 2025 |
137.29 (2.44%) |
133.46 |
133.09 - 138.92 |
1.3826 times |
Fri 22 August 2025 |
134.02 (5.45%) |
126.98 |
126.30 - 134.60 |
0.9195 times |
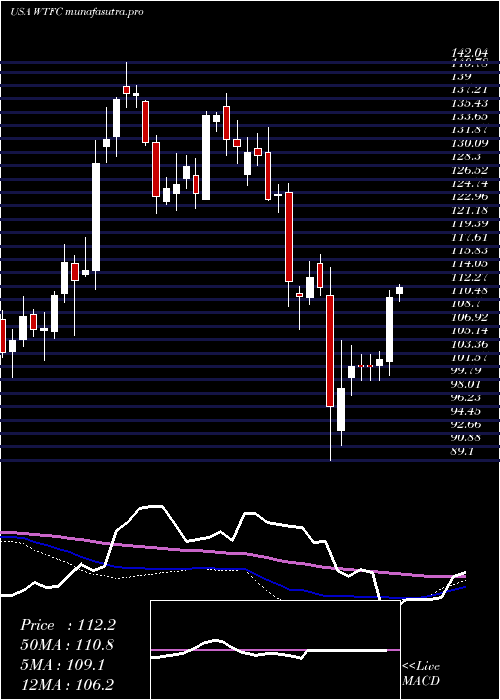
Monthly price and charts WintrustFinancial Strong monthly Stock price targets for WintrustFinancial WTFC are 115.22 and 130.98 | Monthly Target 1 | 111.43 | | Monthly Target 2 | 119 | | Monthly Target 3 | 127.18666666667 | | Monthly Target 4 | 134.76 | | Monthly Target 5 | 142.95 |
Monthly price and volumes Wintrust Financial
| Date |
Closing |
Open |
Range |
Volume |
Mon 20 October 2025 |
126.58 (-4.42%) |
132.08 |
119.61 - 135.37 |
0.7534 times |
Tue 30 September 2025 |
132.44 (-3.53%) |
135.46 |
130.57 - 141.69 |
0.9305 times |
Fri 29 August 2025 |
137.29 (7.27%) |
125.53 |
121.81 - 138.92 |
0.9486 times |
Thu 31 July 2025 |
127.98 (3.23%) |
123.29 |
123.25 - 136.79 |
1.1681 times |
Mon 30 June 2025 |
123.98 (3.83%) |
118.78 |
116.57 - 125.20 |
0.8256 times |
Fri 30 May 2025 |
119.41 (7.41%) |
113.80 |
110.54 - 123.46 |
0.7352 times |
Wed 30 April 2025 |
111.17 (-1.15%) |
110.66 |
89.10 - 114.73 |
1.4416 times |
Mon 31 March 2025 |
112.46 (-9.65%) |
124.80 |
106.56 - 125.99 |
1.0883 times |
Fri 28 February 2025 |
124.47 (-4.85%) |
127.17 |
122.05 - 133.37 |
0.7997 times |
Fri 31 January 2025 |
130.81 (4.89%) |
125.06 |
122.37 - 137.95 |
1.309 times |
Tue 31 December 2024 |
124.71 (-9.56%) |
136.87 |
121.94 - 136.98 |
0.7491 times |

DMA SMA EMA moving averages of Wintrust Financial WTFC
DMA (daily moving average) of Wintrust Financial WTFC
| DMA period | DMA value | | 5 day DMA | 125.89 | | 12 day DMA | 128.43 | | 20 day DMA | 130.05 | | 35 day DMA | 132.71 | | 50 day DMA | 132.49 | | 100 day DMA | 129.27 | | 150 day DMA | 123.16 | | 200 day DMA | 123.95 | EMA (exponential moving average) of Wintrust Financial WTFC
| EMA period | EMA current | EMA prev | EMA prev2 | | 5 day EMA | 125.65 | 125.19 | 126.33 | | 12 day EMA | 127.76 | 127.97 | 128.89 | | 20 day EMA | 129.23 | 129.51 | 130.21 | | 35 day EMA | 130.24 | 130.46 | 130.91 | | 50 day EMA | 131.11 | 131.3 | 131.64 |
SMA (simple moving average) of Wintrust Financial WTFC
| SMA period | SMA current | SMA prev | SMA prev2 | | 5 day SMA | 125.89 | 126.26 | 126.79 | | 12 day SMA | 128.43 | 128.78 | 129.51 | | 20 day SMA | 130.05 | 130.39 | 131 | | 35 day SMA | 132.71 | 133.02 | 133.43 | | 50 day SMA | 132.49 | 132.41 | 132.43 | | 100 day SMA | 129.27 | 129.22 | 129.17 | | 150 day SMA | 123.16 | 123.04 | 122.95 | | 200 day SMA | 123.95 | 123.94 | 123.95 |
|
|
