WhitestoneReit WSR full analysis,charts,indicators,moving averages,SMA,DMA,EMA,ADX,MACD,RSIWhitestone Reit WSR WideScreen charts, DMA,SMA,EMA technical analysis, forecast prediction, by indicators ADX,MACD,RSI,CCI USA stock exchange
operates under Consumer Services sector & deals in Real Estate Investment Trusts
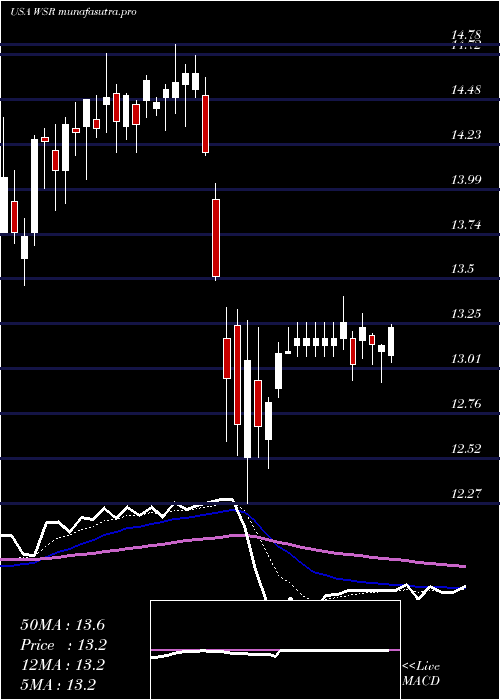
Daily price and charts and targets WhitestoneReit Strong Daily Stock price targets for WhitestoneReit WSR are 13.22 and 13.35 | Daily Target 1 | 13.13 | | Daily Target 2 | 13.18 | | Daily Target 3 | 13.256666666667 | | Daily Target 4 | 13.31 | | Daily Target 5 | 13.39 |
Daily price and volume Whitestone Reit
| Date |
Closing |
Open |
Range |
Volume |
Thu 04 December 2025 |
13.24 (-0.15%) |
13.20 |
13.20 - 13.33 |
0.8878 times |
Wed 03 December 2025 |
13.26 (0.45%) |
13.22 |
13.17 - 13.33 |
0.6909 times |
Tue 02 December 2025 |
13.20 (0.76%) |
13.19 |
13.08 - 13.25 |
0.8905 times |
Mon 01 December 2025 |
13.10 (-1.43%) |
13.18 |
13.10 - 13.26 |
1.233 times |
Fri 28 November 2025 |
13.29 (-0.6%) |
13.37 |
13.28 - 13.39 |
0.4207 times |
Wed 26 November 2025 |
13.37 (0.15%) |
13.30 |
13.30 - 13.61 |
1.7256 times |
Tue 25 November 2025 |
13.35 (1.44%) |
13.15 |
13.15 - 13.50 |
1.126 times |
Mon 24 November 2025 |
13.16 (-1.79%) |
13.38 |
13.16 - 13.41 |
1.4829 times |
Fri 21 November 2025 |
13.40 (1.52%) |
13.23 |
13.19 - 13.48 |
0.8675 times |
Thu 20 November 2025 |
13.20 (0.61%) |
13.22 |
13.16 - 13.29 |
0.6751 times |
Wed 19 November 2025 |
13.12 (0.08%) |
13.07 |
12.93 - 13.15 |
1.0298 times |
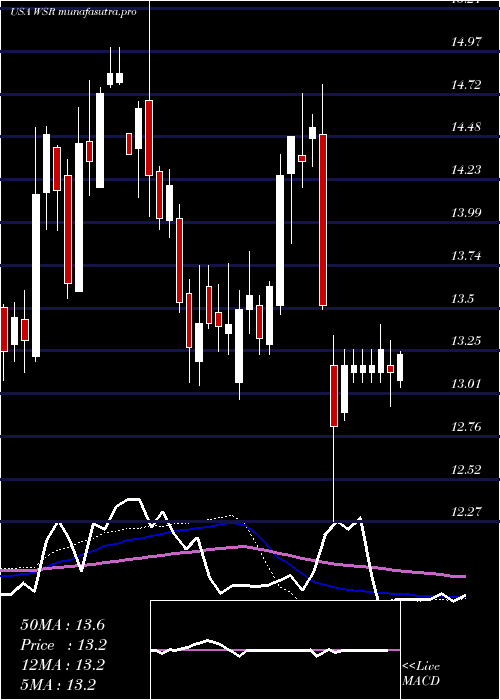
Weekly price and charts WhitestoneReit Strong weekly Stock price targets for WhitestoneReit WSR are 13.16 and 13.41 | Weekly Target 1 | 12.97 | | Weekly Target 2 | 13.1 | | Weekly Target 3 | 13.216666666667 | | Weekly Target 4 | 13.35 | | Weekly Target 5 | 13.47 |
Weekly price and volumes for Whitestone Reit
| Date |
Closing |
Open |
Range |
Volume |
Thu 04 December 2025 |
13.24 (-0.38%) |
13.18 |
13.08 - 13.33 |
0.8743 times |
Fri 28 November 2025 |
13.29 (-0.82%) |
13.38 |
13.15 - 13.61 |
1.123 times |
Fri 21 November 2025 |
13.40 (0.37%) |
13.40 |
12.93 - 13.48 |
1.0616 times |
Fri 14 November 2025 |
13.35 (0%) |
13.35 |
13.13 - 13.57 |
1.066 times |
Fri 07 November 2025 |
13.35 (6.46%) |
13.76 |
13.00 - 13.90 |
1.3785 times |
Fri 31 October 2025 |
12.54 (0%) |
12.86 |
12.52 - 12.86 |
0.3228 times |
Fri 31 October 2025 |
12.54 (2.79%) |
12.22 |
11.92 - 13.02 |
1.4179 times |
Fri 24 October 2025 |
12.20 (2.52%) |
12.12 |
11.86 - 12.24 |
0.7736 times |
Fri 17 October 2025 |
11.90 (3.84%) |
11.49 |
11.45 - 12.08 |
0.9454 times |
Fri 10 October 2025 |
11.46 (-5.05%) |
12.06 |
11.43 - 12.06 |
1.0368 times |
Fri 03 October 2025 |
12.07 (-3.44%) |
12.49 |
11.94 - 12.50 |
1.13 times |
Monthly price and charts WhitestoneReit Strong monthly Stock price targets for WhitestoneReit WSR are 13.16 and 13.41 | Monthly Target 1 | 12.97 | | Monthly Target 2 | 13.1 | | Monthly Target 3 | 13.216666666667 | | Monthly Target 4 | 13.35 | | Monthly Target 5 | 13.47 |
Monthly price and volumes Whitestone Reit
| Date |
Closing |
Open |
Range |
Volume |
Thu 04 December 2025 |
13.24 (-0.38%) |
13.18 |
13.08 - 13.33 |
0.181 times |
Fri 28 November 2025 |
13.29 (5.98%) |
13.76 |
12.93 - 13.90 |
0.9582 times |
Fri 31 October 2025 |
12.54 (2.12%) |
12.13 |
11.43 - 13.02 |
1.0583 times |
Tue 30 September 2025 |
12.28 (-6.69%) |
13.02 |
12.19 - 13.24 |
0.9943 times |
Fri 29 August 2025 |
13.16 (7.96%) |
12.13 |
11.80 - 13.19 |
0.8844 times |
Thu 31 July 2025 |
12.19 (-2.32%) |
12.39 |
12.11 - 12.83 |
1.112 times |
Mon 30 June 2025 |
12.48 (1.3%) |
12.28 |
12.07 - 12.65 |
1.1128 times |
Fri 30 May 2025 |
12.32 (-5.52%) |
12.56 |
11.78 - 12.87 |
1.2929 times |
Wed 30 April 2025 |
13.04 (-10.5%) |
14.56 |
12.27 - 14.72 |
1.105 times |
Mon 31 March 2025 |
14.57 (6.98%) |
13.51 |
13.46 - 14.78 |
1.3011 times |
Fri 28 February 2025 |
13.62 (1.64%) |
13.07 |
12.97 - 13.82 |
0.7513 times |

DMA SMA EMA moving averages of Whitestone Reit WSR
DMA (daily moving average) of Whitestone Reit WSR
| DMA period | DMA value | | 5 day DMA | 13.22 | | 12 day DMA | 13.23 | | 20 day DMA | 13.26 | | 35 day DMA | 12.86 | | 50 day DMA | 12.6 | | 100 day DMA | 12.61 | | 150 day DMA | 12.57 | | 200 day DMA | 12.84 | EMA (exponential moving average) of Whitestone Reit WSR
| EMA period | EMA current | EMA prev | EMA prev2 | | 5 day EMA | 13.23 | 13.23 | 13.22 | | 12 day EMA | 13.21 | 13.21 | 13.2 | | 20 day EMA | 13.13 | 13.12 | 13.11 | | 35 day EMA | 12.94 | 12.92 | 12.9 | | 50 day EMA | 12.67 | 12.65 | 12.63 |
SMA (simple moving average) of Whitestone Reit WSR
| SMA period | SMA current | SMA prev | SMA prev2 | | 5 day SMA | 13.22 | 13.24 | 13.26 | | 12 day SMA | 13.23 | 13.23 | 13.23 | | 20 day SMA | 13.26 | 13.25 | 13.24 | | 35 day SMA | 12.86 | 12.83 | 12.79 | | 50 day SMA | 12.6 | 12.59 | 12.59 | | 100 day SMA | 12.61 | 12.6 | 12.6 | | 150 day SMA | 12.57 | 12.57 | 12.57 | | 200 day SMA | 12.84 | 12.84 | 12.84 |
|
|
