WilliamsSonoma WSM full analysis,charts,indicators,moving averages,SMA,DMA,EMA,ADX,MACD,RSIWilliams Sonoma WSM WideScreen charts, DMA,SMA,EMA technical analysis, forecast prediction, by indicators ADX,MACD,RSI,CCI USA stock exchange
operates under Consumer Services sector & deals in Home Furnishings
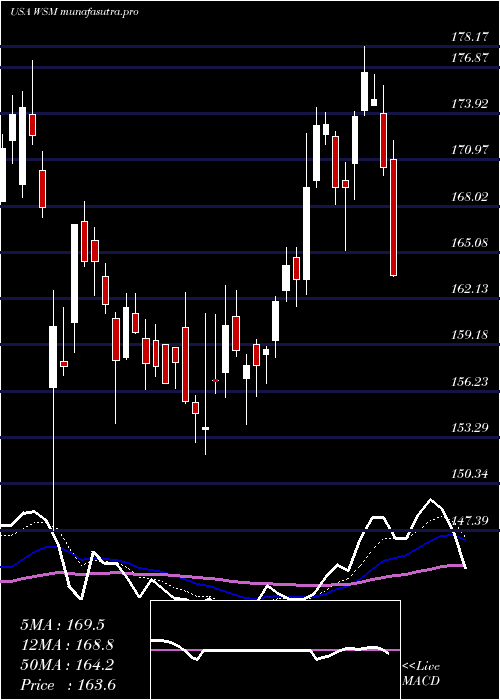
Daily price and charts and targets WilliamsSonoma Strong Daily Stock price targets for WilliamsSonoma WSM are 188.01 and 192.66 | Daily Target 1 | 184.3 | | Daily Target 2 | 187.06 | | Daily Target 3 | 188.94666666667 | | Daily Target 4 | 191.71 | | Daily Target 5 | 193.6 |
Daily price and volume Williams Sonoma
| Date |
Closing |
Open |
Range |
Volume |
Mon 20 October 2025 |
189.83 (2.41%) |
186.18 |
186.18 - 190.83 |
0.8505 times |
Fri 17 October 2025 |
185.36 (-1.14%) |
186.68 |
184.72 - 188.65 |
0.7025 times |
Thu 16 October 2025 |
187.50 (-1.35%) |
191.59 |
185.76 - 191.59 |
0.8412 times |
Wed 15 October 2025 |
190.06 (-0.75%) |
192.62 |
190.01 - 193.79 |
0.557 times |
Tue 14 October 2025 |
191.50 (0.79%) |
187.67 |
185.11 - 192.73 |
0.9038 times |
Mon 13 October 2025 |
190.00 (4.71%) |
184.88 |
184.03 - 190.56 |
0.8234 times |
Fri 10 October 2025 |
181.45 (-4.14%) |
190.87 |
181.13 - 192.27 |
1.8071 times |
Thu 09 October 2025 |
189.29 (-0.95%) |
190.95 |
187.44 - 191.19 |
1.1864 times |
Wed 08 October 2025 |
191.11 (1.08%) |
189.88 |
188.32 - 191.47 |
0.9167 times |
Tue 07 October 2025 |
189.06 (-3.61%) |
195.87 |
188.84 - 196.09 |
1.4115 times |
Mon 06 October 2025 |
196.15 (-1.64%) |
199.00 |
195.51 - 199.10 |
0.5243 times |
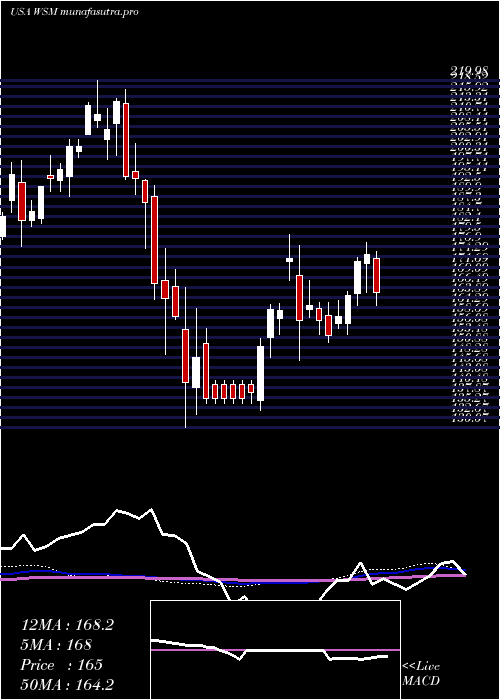
Weekly price and charts WilliamsSonoma Strong weekly Stock price targets for WilliamsSonoma WSM are 188.01 and 192.66 | Weekly Target 1 | 184.3 | | Weekly Target 2 | 187.06 | | Weekly Target 3 | 188.94666666667 | | Weekly Target 4 | 191.71 | | Weekly Target 5 | 193.6 |
Weekly price and volumes for Williams Sonoma
| Date |
Closing |
Open |
Range |
Volume |
Mon 20 October 2025 |
189.83 (2.41%) |
186.18 |
186.18 - 190.83 |
0.184 times |
Fri 17 October 2025 |
185.36 (2.15%) |
184.88 |
184.03 - 193.79 |
0.828 times |
Fri 10 October 2025 |
181.45 (-9.02%) |
199.00 |
181.13 - 199.10 |
1.2645 times |
Fri 03 October 2025 |
199.43 (-0.95%) |
196.97 |
191.38 - 203.71 |
1.0058 times |
Fri 26 September 2025 |
201.35 (1.56%) |
197.58 |
195.08 - 202.45 |
1.1414 times |
Fri 19 September 2025 |
198.25 (0.66%) |
197.09 |
193.62 - 203.10 |
1.2874 times |
Fri 12 September 2025 |
196.95 (-2.7%) |
202.48 |
195.78 - 205.17 |
0.8618 times |
Fri 05 September 2025 |
202.42 (7.56%) |
187.45 |
186.00 - 206.40 |
0.9417 times |
Fri 29 August 2025 |
188.19 (0%) |
187.44 |
186.01 - 188.72 |
0.3256 times |
Fri 29 August 2025 |
188.19 (-7.49%) |
196.10 |
186.01 - 205.00 |
2.1598 times |
Fri 22 August 2025 |
203.42 (0.09%) |
202.42 |
194.31 - 206.01 |
1.3455 times |
Monthly price and charts WilliamsSonoma Strong monthly Stock price targets for WilliamsSonoma WSM are 174.19 and 196.77 | Monthly Target 1 | 168.98 | | Monthly Target 2 | 179.4 | | Monthly Target 3 | 191.55666666667 | | Monthly Target 4 | 201.98 | | Monthly Target 5 | 214.14 |
Monthly price and volumes Williams Sonoma
| Date |
Closing |
Open |
Range |
Volume |
Mon 20 October 2025 |
189.83 (-2.88%) |
196.24 |
181.13 - 203.71 |
0.3888 times |
Tue 30 September 2025 |
195.45 (3.86%) |
187.45 |
186.00 - 206.40 |
0.6755 times |
Fri 29 August 2025 |
188.19 (0.61%) |
184.20 |
181.51 - 210.59 |
0.9191 times |
Thu 31 July 2025 |
187.05 (14.49%) |
163.37 |
161.76 - 192.38 |
0.7453 times |
Mon 30 June 2025 |
163.37 (1%) |
160.89 |
152.20 - 165.41 |
0.9458 times |
Fri 30 May 2025 |
161.76 (4.72%) |
157.99 |
147.39 - 180.07 |
1.1774 times |
Wed 30 April 2025 |
154.47 (-2.3%) |
157.52 |
130.07 - 166.34 |
1.4766 times |
Mon 31 March 2025 |
158.10 (-18.75%) |
194.16 |
149.06 - 194.38 |
2.1315 times |
Fri 28 February 2025 |
194.58 (-7.94%) |
204.72 |
190.53 - 217.82 |
0.6771 times |
Fri 31 January 2025 |
211.37 (14.14%) |
186.95 |
184.71 - 219.98 |
0.8628 times |
Tue 31 December 2024 |
185.18 (6.43%) |
179.52 |
177.01 - 199.41 |
0.968 times |
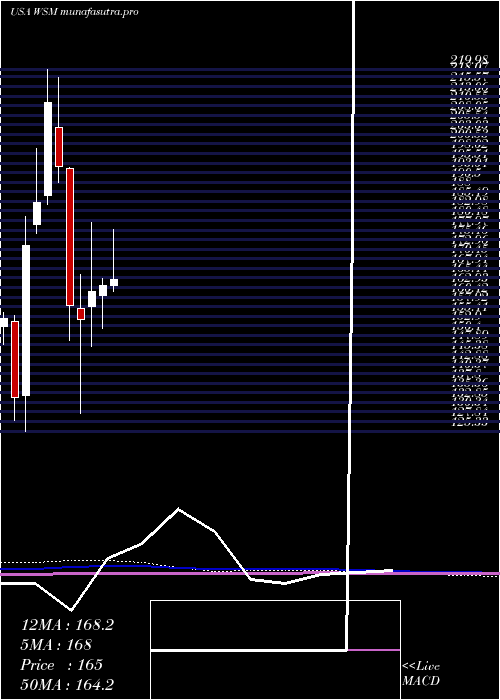
DMA SMA EMA moving averages of Williams Sonoma WSM
DMA (daily moving average) of Williams Sonoma WSM
| DMA period | DMA value | | 5 day DMA | 188.85 | | 12 day DMA | 190.06 | | 20 day DMA | 193.14 | | 35 day DMA | 195.7 | | 50 day DMA | 196.64 | | 100 day DMA | 183.98 | | 150 day DMA | 174.38 | | 200 day DMA | 180.44 | EMA (exponential moving average) of Williams Sonoma WSM
| EMA period | EMA current | EMA prev | EMA prev2 | | 5 day EMA | 188.51 | 187.85 | 189.09 | | 12 day EMA | 190.12 | 190.17 | 191.04 | | 20 day EMA | 191.96 | 192.18 | 192.9 | | 35 day EMA | 194.14 | 194.39 | 194.92 | | 50 day EMA | 196.2 | 196.46 | 196.91 |
SMA (simple moving average) of Williams Sonoma WSM
| SMA period | SMA current | SMA prev | SMA prev2 | | 5 day SMA | 188.85 | 188.88 | 188.1 | | 12 day SMA | 190.06 | 190.59 | 191.42 | | 20 day SMA | 193.14 | 193.48 | 194.13 | | 35 day SMA | 195.7 | 195.66 | 195.74 | | 50 day SMA | 196.64 | 196.85 | 197.13 | | 100 day SMA | 183.98 | 183.75 | 183.47 | | 150 day SMA | 174.38 | 174.27 | 174.2 | | 200 day SMA | 180.44 | 180.49 | 180.53 |
|
|
