WsfsFinancial WSFS full analysis,charts,indicators,moving averages,SMA,DMA,EMA,ADX,MACD,RSIWsfs Financial WSFS WideScreen charts, DMA,SMA,EMA technical analysis, forecast prediction, by indicators ADX,MACD,RSI,CCI USA stock exchange
operates under Finance sector & deals in Major Banks
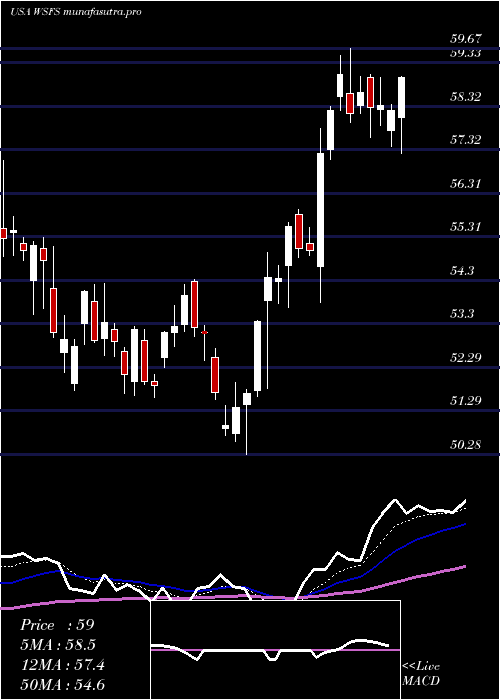
Daily price and charts and targets WsfsFinancial Strong Daily Stock price targets for WsfsFinancial WSFS are 55.73 and 56.74 | Daily Target 1 | 54.96 | | Daily Target 2 | 55.49 | | Daily Target 3 | 55.966666666667 | | Daily Target 4 | 56.5 | | Daily Target 5 | 56.98 |
Daily price and volume Wsfs Financial
| Date |
Closing |
Open |
Range |
Volume |
Thu 04 December 2025 |
56.03 (0.3%) |
55.81 |
55.43 - 56.44 |
0.9773 times |
Wed 03 December 2025 |
55.86 (0.88%) |
55.54 |
55.54 - 56.30 |
1.3402 times |
Tue 02 December 2025 |
55.37 (-1.39%) |
56.41 |
55.27 - 56.68 |
0.9962 times |
Mon 01 December 2025 |
56.15 (0.61%) |
55.37 |
55.37 - 56.47 |
0.8602 times |
Fri 28 November 2025 |
55.81 (-1.05%) |
56.39 |
55.59 - 56.61 |
0.6076 times |
Wed 26 November 2025 |
56.40 (-0.46%) |
56.57 |
56.26 - 57.03 |
1.4437 times |
Tue 25 November 2025 |
56.66 (2.33%) |
55.69 |
55.58 - 57.11 |
0.9482 times |
Mon 24 November 2025 |
55.37 (-0.5%) |
55.46 |
54.99 - 55.72 |
0.641 times |
Fri 21 November 2025 |
55.65 (2.96%) |
54.18 |
53.96 - 56.54 |
1.3208 times |
Thu 20 November 2025 |
54.05 (0.02%) |
54.56 |
54.01 - 55.43 |
0.8648 times |
Wed 19 November 2025 |
54.04 (1.73%) |
53.21 |
53.05 - 54.18 |
0.7986 times |
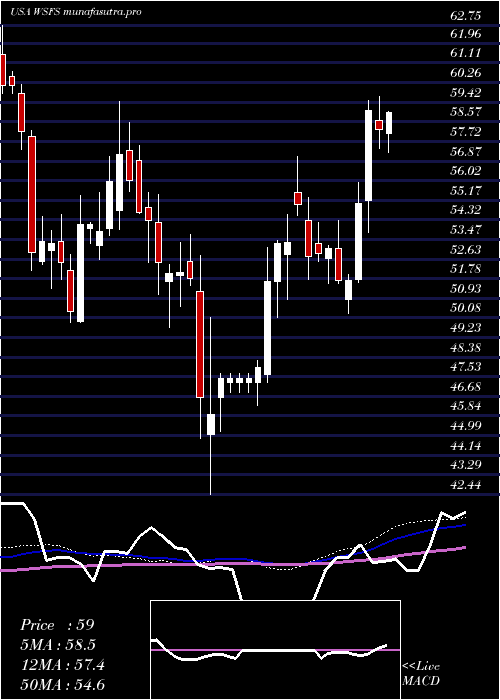
Weekly price and charts WsfsFinancial Strong weekly Stock price targets for WsfsFinancial WSFS are 55.65 and 57.06 | Weekly Target 1 | 54.58 | | Weekly Target 2 | 55.31 | | Weekly Target 3 | 55.993333333333 | | Weekly Target 4 | 56.72 | | Weekly Target 5 | 57.4 |
Weekly price and volumes for Wsfs Financial
| Date |
Closing |
Open |
Range |
Volume |
Thu 04 December 2025 |
56.03 (0.39%) |
55.37 |
55.27 - 56.68 |
1.1465 times |
Fri 28 November 2025 |
55.81 (0.29%) |
55.46 |
54.99 - 57.11 |
1 times |
Fri 21 November 2025 |
55.65 (2.02%) |
54.44 |
51.40 - 56.54 |
1.3652 times |
Fri 14 November 2025 |
54.55 (0.33%) |
54.42 |
53.51 - 56.12 |
1.1336 times |
Fri 07 November 2025 |
54.37 (4.38%) |
52.18 |
51.95 - 54.45 |
0.9189 times |
Fri 31 October 2025 |
52.09 (0%) |
52.80 |
51.74 - 53.00 |
0.2499 times |
Fri 31 October 2025 |
52.09 (-1.75%) |
53.34 |
51.74 - 54.03 |
1.2832 times |
Fri 24 October 2025 |
53.02 (3.27%) |
51.50 |
51.40 - 54.48 |
0.9192 times |
Fri 17 October 2025 |
51.34 (-0.5%) |
52.18 |
49.92 - 54.63 |
1.1508 times |
Fri 10 October 2025 |
51.60 (-4.34%) |
53.95 |
51.53 - 55.24 |
0.8326 times |
Fri 03 October 2025 |
53.94 (-2.11%) |
55.14 |
52.87 - 55.14 |
0.7628 times |
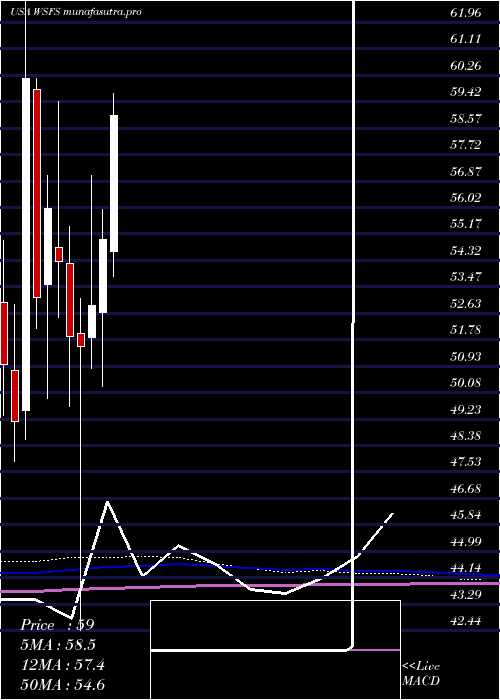
Monthly price and charts WsfsFinancial Strong monthly Stock price targets for WsfsFinancial WSFS are 55.65 and 57.06 | Monthly Target 1 | 54.58 | | Monthly Target 2 | 55.31 | | Monthly Target 3 | 55.993333333333 | | Monthly Target 4 | 56.72 | | Monthly Target 5 | 57.4 |
Monthly price and volumes Wsfs Financial
| Date |
Closing |
Open |
Range |
Volume |
Thu 04 December 2025 |
56.03 (0.39%) |
55.37 |
55.27 - 56.68 |
0.2627 times |
Fri 28 November 2025 |
55.81 (7.14%) |
52.18 |
51.40 - 57.11 |
1.0122 times |
Fri 31 October 2025 |
52.09 (-3.41%) |
53.64 |
49.92 - 55.24 |
1.1195 times |
Tue 30 September 2025 |
53.93 (-7.48%) |
57.72 |
53.37 - 59.13 |
1.0335 times |
Fri 29 August 2025 |
58.29 (6.29%) |
54.12 |
52.80 - 59.29 |
1.0093 times |
Thu 31 July 2025 |
54.84 (-0.29%) |
54.61 |
53.79 - 59.67 |
1.0685 times |
Mon 30 June 2025 |
55.00 (3.99%) |
52.66 |
50.28 - 55.94 |
1.0897 times |
Fri 30 May 2025 |
52.89 (2.6%) |
51.86 |
50.87 - 57.06 |
0.9889 times |
Wed 30 April 2025 |
51.55 (-0.62%) |
51.97 |
42.44 - 53.11 |
1.3288 times |
Mon 31 March 2025 |
51.87 (-4.46%) |
54.21 |
49.65 - 55.42 |
1.0869 times |
Fri 28 February 2025 |
54.29 (-3.05%) |
54.74 |
52.48 - 59.43 |
0.6667 times |
DMA SMA EMA moving averages of Wsfs Financial WSFS
DMA (daily moving average) of Wsfs Financial WSFS
| DMA period | DMA value | | 5 day DMA | 55.84 | | 12 day DMA | 55.38 | | 20 day DMA | 54.94 | | 35 day DMA | 53.95 | | 50 day DMA | 53.92 | | 100 day DMA | 55.13 | | 150 day DMA | 54.89 | | 200 day DMA | 53.86 | EMA (exponential moving average) of Wsfs Financial WSFS
| EMA period | EMA current | EMA prev | EMA prev2 | | 5 day EMA | 55.85 | 55.76 | 55.71 | | 12 day EMA | 55.45 | 55.34 | 55.25 | | 20 day EMA | 55.03 | 54.93 | 54.83 | | 35 day EMA | 54.66 | 54.58 | 54.5 | | 50 day EMA | 54.23 | 54.16 | 54.09 |
SMA (simple moving average) of Wsfs Financial WSFS
| SMA period | SMA current | SMA prev | SMA prev2 | | 5 day SMA | 55.84 | 55.92 | 56.08 | | 12 day SMA | 55.38 | 55.06 | 54.95 | | 20 day SMA | 54.94 | 54.84 | 54.68 | | 35 day SMA | 53.95 | 53.88 | 53.84 | | 50 day SMA | 53.92 | 53.89 | 53.88 | | 100 day SMA | 55.13 | 55.14 | 55.17 | | 150 day SMA | 54.89 | 54.86 | 54.83 | | 200 day SMA | 53.86 | 53.86 | 53.86 |
|
|
