WorthingtonIndustries WOR full analysis,charts,indicators,moving averages,SMA,DMA,EMA,ADX,MACD,RSIWorthington Industries WOR WideScreen charts, DMA,SMA,EMA technical analysis, forecast prediction, by indicators ADX,MACD,RSI,CCI USA stock exchange
operates under Capital Goods sector & deals in Steel Iron Ore
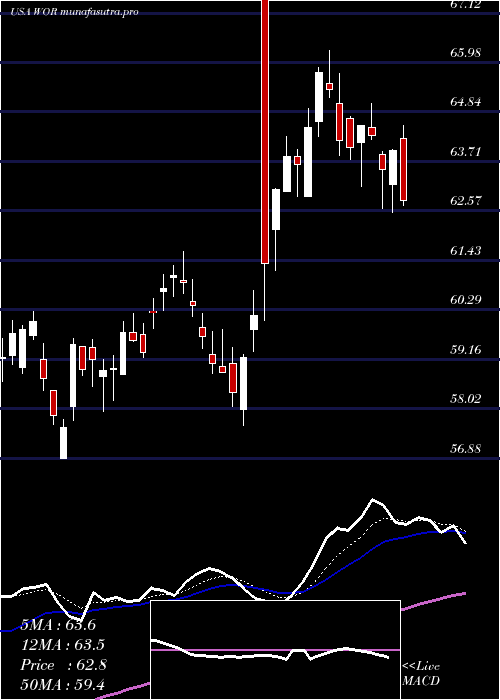
Daily price and charts and targets WorthingtonIndustries Strong Daily Stock price targets for WorthingtonIndustries WOR are 55.97 and 57.05 | Daily Target 1 | 55.71 | | Daily Target 2 | 56.23 | | Daily Target 3 | 56.79 | | Daily Target 4 | 57.31 | | Daily Target 5 | 57.87 |
Daily price and volume Worthington Industries
| Date |
Closing |
Open |
Range |
Volume |
Mon 20 October 2025 |
56.75 (0.41%) |
56.98 |
56.27 - 57.35 |
0.6017 times |
Fri 17 October 2025 |
56.52 (-0.23%) |
56.53 |
56.20 - 56.90 |
0.8791 times |
Thu 16 October 2025 |
56.65 (-1.7%) |
57.46 |
56.32 - 57.67 |
1.3245 times |
Wed 15 October 2025 |
57.63 (0.77%) |
57.51 |
57.08 - 58.05 |
1.0349 times |
Tue 14 October 2025 |
57.19 (3.12%) |
55.00 |
54.79 - 57.64 |
1.062 times |
Mon 13 October 2025 |
55.46 (0.04%) |
55.54 |
55.04 - 55.86 |
0.8459 times |
Tue 07 October 2025 |
55.44 (0.07%) |
55.43 |
54.65 - 55.52 |
1.1355 times |
Mon 06 October 2025 |
55.40 (-0.41%) |
55.86 |
55.07 - 55.86 |
0.7132 times |
Fri 03 October 2025 |
55.63 (-0.48%) |
56.11 |
55.43 - 56.63 |
1.3889 times |
Thu 02 October 2025 |
55.90 (1.27%) |
55.26 |
55.03 - 56.03 |
1.0144 times |
Wed 01 October 2025 |
55.20 (-0.52%) |
55.05 |
54.84 - 55.79 |
1.2152 times |
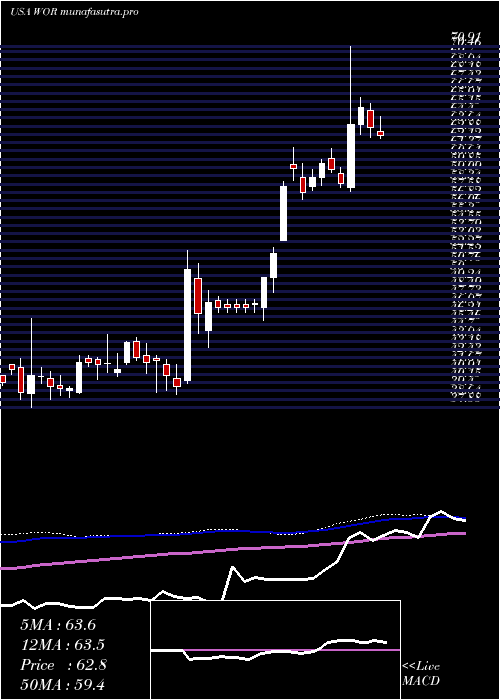
Weekly price and charts WorthingtonIndustries Strong weekly Stock price targets for WorthingtonIndustries WOR are 55.97 and 57.05 | Weekly Target 1 | 55.71 | | Weekly Target 2 | 56.23 | | Weekly Target 3 | 56.79 | | Weekly Target 4 | 57.31 | | Weekly Target 5 | 57.87 |
Weekly price and volumes for Worthington Industries
| Date |
Closing |
Open |
Range |
Volume |
Mon 20 October 2025 |
56.75 (0.41%) |
56.98 |
56.27 - 57.35 |
0.1088 times |
Fri 17 October 2025 |
56.52 (1.95%) |
55.54 |
54.79 - 58.05 |
0.9305 times |
Tue 07 October 2025 |
55.44 (-0.34%) |
55.86 |
54.65 - 55.86 |
0.3343 times |
Fri 03 October 2025 |
55.63 (2.26%) |
54.76 |
54.39 - 56.63 |
1.3749 times |
Fri 26 September 2025 |
54.40 (-10.91%) |
61.10 |
50.55 - 61.88 |
3.1652 times |
Fri 19 September 2025 |
61.06 (-4.23%) |
64.11 |
60.72 - 64.59 |
1.3964 times |
Fri 12 September 2025 |
63.76 (-2.01%) |
65.21 |
62.72 - 65.69 |
1.0883 times |
Fri 05 September 2025 |
65.07 (-1.11%) |
64.81 |
63.91 - 66.47 |
0.6619 times |
Fri 29 August 2025 |
65.80 (0%) |
66.87 |
65.42 - 67.21 |
0.1325 times |
Fri 29 August 2025 |
65.80 (-1.86%) |
67.15 |
65.42 - 67.80 |
0.8071 times |
Fri 22 August 2025 |
67.05 (3.34%) |
64.69 |
63.88 - 67.28 |
0.6882 times |
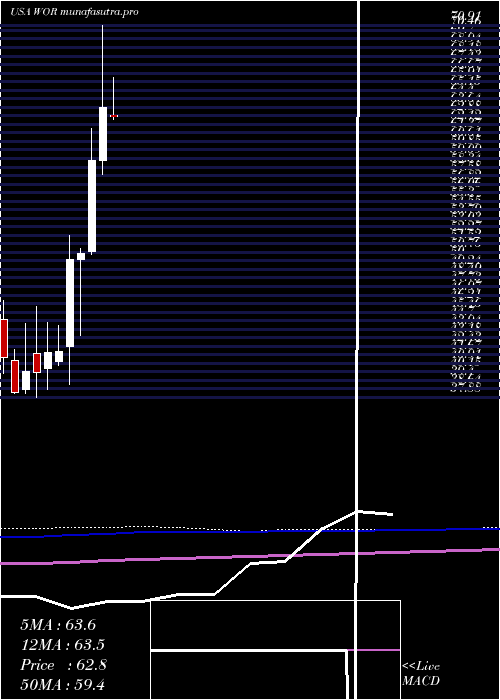
Monthly price and charts WorthingtonIndustries Strong monthly Stock price targets for WorthingtonIndustries WOR are 55.7 and 59.1 | Monthly Target 1 | 53.08 | | Monthly Target 2 | 54.92 | | Monthly Target 3 | 56.483333333333 | | Monthly Target 4 | 58.32 | | Monthly Target 5 | 59.88 |
Monthly price and volumes Worthington Industries
| Date |
Closing |
Open |
Range |
Volume |
Mon 20 October 2025 |
56.75 (2.27%) |
55.05 |
54.65 - 58.05 |
0.3645 times |
Tue 30 September 2025 |
55.49 (-15.67%) |
64.81 |
50.55 - 66.47 |
1.264 times |
Fri 29 August 2025 |
65.80 (6.18%) |
61.38 |
60.15 - 67.80 |
0.6566 times |
Thu 31 July 2025 |
61.97 (-2.62%) |
62.91 |
60.50 - 66.26 |
1.0298 times |
Mon 30 June 2025 |
63.64 (8.03%) |
58.93 |
57.63 - 70.91 |
0.961 times |
Fri 30 May 2025 |
58.91 (16.35%) |
50.86 |
50.59 - 61.71 |
0.9299 times |
Wed 30 April 2025 |
50.63 (1.08%) |
50.12 |
43.35 - 51.08 |
1.1209 times |
Mon 31 March 2025 |
50.09 (19.29%) |
42.38 |
39.05 - 52.28 |
1.8174 times |
Fri 28 February 2025 |
41.99 (0.21%) |
41.04 |
40.72 - 44.29 |
0.8616 times |
Fri 31 January 2025 |
41.90 (4.46%) |
40.49 |
38.63 - 44.53 |
0.9943 times |
Tue 31 December 2024 |
40.11 (-0.15%) |
41.81 |
37.88 - 46.00 |
0.9316 times |
DMA SMA EMA moving averages of Worthington Industries WOR
DMA (daily moving average) of Worthington Industries WOR
| DMA period | DMA value | | 5 day DMA | 56.95 | | 12 day DMA | 56.11 | | 20 day DMA | 56.68 | | 35 day DMA | 59.98 | | 50 day DMA | 61.55 | | 100 day DMA | 61.55 | | 150 day DMA | 57.66 | | 200 day DMA | 53.64 | EMA (exponential moving average) of Worthington Industries WOR
| EMA period | EMA current | EMA prev | EMA prev2 | | 5 day EMA | 56.63 | 56.57 | 56.6 | | 12 day EMA | 56.67 | 56.65 | 56.67 | | 20 day EMA | 57.42 | 57.49 | 57.59 | | 35 day EMA | 59 | 59.13 | 59.28 | | 50 day EMA | 61.15 | 61.33 | 61.53 |
SMA (simple moving average) of Worthington Industries WOR
| SMA period | SMA current | SMA prev | SMA prev2 | | 5 day SMA | 56.95 | 56.69 | 56.47 | | 12 day SMA | 56.11 | 55.94 | 55.76 | | 20 day SMA | 56.68 | 56.89 | 57.14 | | 35 day SMA | 59.98 | 60.28 | 60.58 | | 50 day SMA | 61.55 | 61.68 | 61.81 | | 100 day SMA | 61.55 | 61.56 | 61.6 | | 150 day SMA | 57.66 | 57.55 | 57.45 | | 200 day SMA | 53.64 | 53.56 | 53.48 |
|
|
