WalmartInc WMT full analysis,charts,indicators,moving averages,SMA,DMA,EMA,ADX,MACD,RSIWalmart Inc WMT WideScreen charts, DMA,SMA,EMA technical analysis, forecast prediction, by indicators ADX,MACD,RSI,CCI USA stock exchange
operates under Consumer Services sector & deals in Department Specialty Retail Stores
Daily price and charts and targets WalmartInc Strong Daily Stock price targets for WalmartInc WMT are 114 and 115.73 | Daily Target 1 | 112.57 | | Daily Target 2 | 113.7 | | Daily Target 3 | 114.29666666667 | | Daily Target 4 | 115.43 | | Daily Target 5 | 116.03 |
Daily price and volume Walmart Inc
| Date |
Closing |
Open |
Range |
Volume |
Thu 04 December 2025 |
114.84 (0.38%) |
114.22 |
113.16 - 114.89 |
0.5603 times |
Wed 03 December 2025 |
114.41 (1.78%) |
112.50 |
112.22 - 114.89 |
0.9526 times |
Tue 02 December 2025 |
112.41 (0.79%) |
111.47 |
110.79 - 112.65 |
0.728 times |
Mon 01 December 2025 |
111.53 (0.92%) |
110.51 |
110.36 - 111.76 |
0.6707 times |
Fri 28 November 2025 |
110.51 (1.29%) |
109.30 |
109.00 - 110.70 |
0.3832 times |
Wed 26 November 2025 |
109.10 (1.96%) |
107.20 |
107.17 - 109.59 |
0.692 times |
Tue 25 November 2025 |
107.00 (2.83%) |
104.61 |
104.23 - 107.42 |
0.7865 times |
Mon 24 November 2025 |
104.06 (-1.2%) |
105.36 |
103.76 - 106.27 |
1.6545 times |
Fri 21 November 2025 |
105.32 (-1.67%) |
107.98 |
104.72 - 108.15 |
1.6117 times |
Thu 20 November 2025 |
107.11 (6.46%) |
103.94 |
102.68 - 107.91 |
1.9604 times |
Wed 19 November 2025 |
100.61 (-0.81%) |
101.58 |
99.68 - 101.71 |
0.8622 times |
Weekly price and charts WalmartInc Strong weekly Stock price targets for WalmartInc WMT are 112.6 and 117.13 | Weekly Target 1 | 108.83 | | Weekly Target 2 | 111.84 | | Weekly Target 3 | 113.36333333333 | | Weekly Target 4 | 116.37 | | Weekly Target 5 | 117.89 |
Weekly price and volumes for Walmart Inc
| Date |
Closing |
Open |
Range |
Volume |
Thu 04 December 2025 |
114.84 (3.92%) |
110.51 |
110.36 - 114.89 |
1.0521 times |
Fri 28 November 2025 |
110.51 (4.93%) |
105.36 |
103.76 - 110.70 |
1.2706 times |
Fri 21 November 2025 |
105.32 (2.77%) |
102.58 |
99.68 - 108.15 |
1.9589 times |
Fri 14 November 2025 |
102.48 (-0.13%) |
102.15 |
98.88 - 103.93 |
0.9731 times |
Fri 07 November 2025 |
102.61 (1.41%) |
101.44 |
100.03 - 102.97 |
0.57 times |
Fri 31 October 2025 |
101.18 (0%) |
101.70 |
100.18 - 102.10 |
0.2846 times |
Fri 31 October 2025 |
101.18 (-4.73%) |
106.34 |
100.18 - 106.36 |
1.0684 times |
Fri 24 October 2025 |
106.20 (-1.48%) |
107.87 |
105.51 - 108.25 |
0.5061 times |
Fri 17 October 2025 |
107.79 (5.84%) |
101.37 |
101.07 - 109.58 |
1.2281 times |
Fri 10 October 2025 |
101.84 (-0.02%) |
102.09 |
100.37 - 103.63 |
1.0882 times |
Fri 03 October 2025 |
101.86 (-1.26%) |
103.05 |
99.87 - 103.93 |
0.9389 times |
Monthly price and charts WalmartInc Strong monthly Stock price targets for WalmartInc WMT are 112.6 and 117.13 | Monthly Target 1 | 108.83 | | Monthly Target 2 | 111.84 | | Monthly Target 3 | 113.36333333333 | | Monthly Target 4 | 116.37 | | Monthly Target 5 | 117.89 |
Monthly price and volumes Walmart Inc
| Date |
Closing |
Open |
Range |
Volume |
Thu 04 December 2025 |
114.84 (3.92%) |
110.51 |
110.36 - 114.89 |
0.2164 times |
Fri 28 November 2025 |
110.51 (9.22%) |
101.44 |
98.88 - 110.70 |
0.9816 times |
Fri 31 October 2025 |
101.18 (-1.82%) |
102.56 |
99.87 - 109.58 |
0.967 times |
Tue 30 September 2025 |
103.06 (6.27%) |
97.23 |
96.51 - 106.11 |
0.9457 times |
Fri 29 August 2025 |
96.98 (-1.02%) |
98.00 |
95.42 - 104.72 |
1.1405 times |
Thu 31 July 2025 |
97.98 (0.2%) |
97.60 |
94.23 - 99.35 |
0.838 times |
Mon 30 June 2025 |
97.78 (-0.95%) |
98.84 |
93.43 - 100.89 |
0.9497 times |
Fri 30 May 2025 |
98.72 (1.51%) |
97.01 |
91.89 - 99.74 |
1.1372 times |
Wed 30 April 2025 |
97.25 (10.78%) |
87.54 |
79.81 - 97.78 |
1.4209 times |
Mon 31 March 2025 |
87.79 (-10.97%) |
97.98 |
83.87 - 99.49 |
1.4031 times |
Fri 28 February 2025 |
98.61 (0.46%) |
96.77 |
92.12 - 105.30 |
1.1382 times |
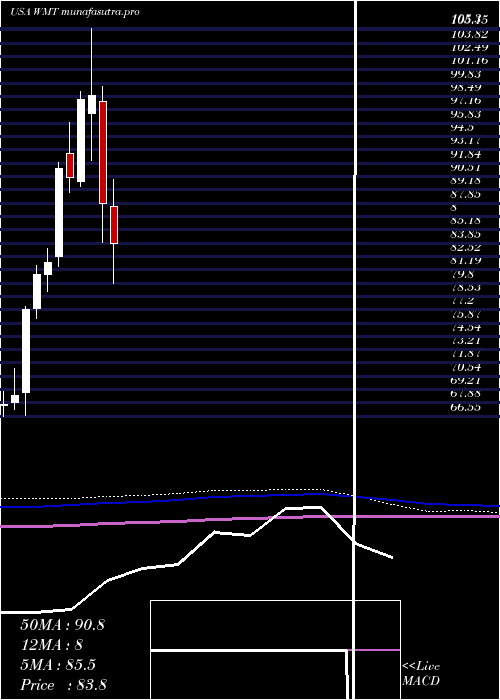
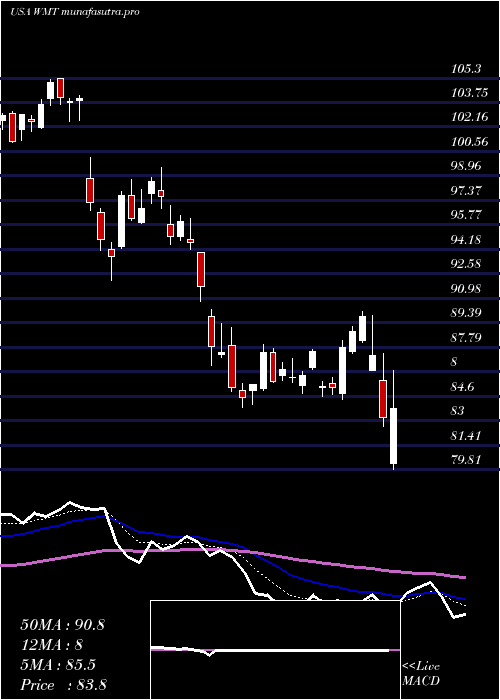
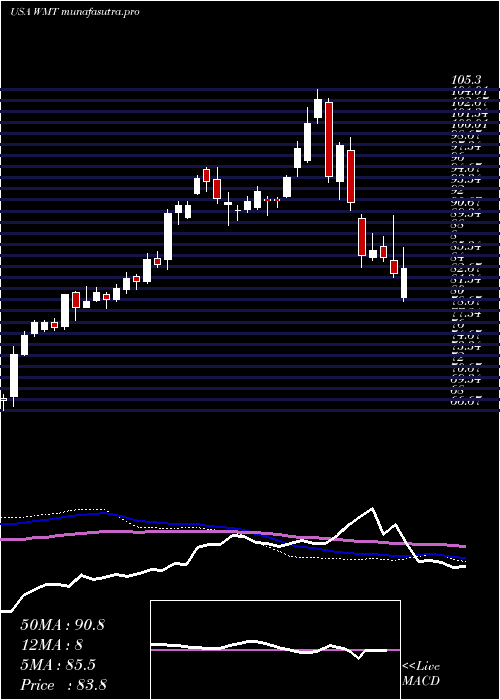
DMA SMA EMA moving averages of Walmart Inc WMT
DMA (daily moving average) of Walmart Inc WMT
| DMA period | DMA value | | 5 day DMA | 112.74 | | 12 day DMA | 108.19 | | 20 day DMA | 106 | | 35 day DMA | 105.31 | | 50 day DMA | 104.69 | | 100 day DMA | 102.23 | | 150 day DMA | 100.54 | | 200 day DMA | 98.22 | EMA (exponential moving average) of Walmart Inc WMT
| EMA period | EMA current | EMA prev | EMA prev2 | | 5 day EMA | 112.67 | 111.58 | 110.16 | | 12 day EMA | 109.52 | 108.55 | 107.49 | | 20 day EMA | 107.66 | 106.91 | 106.12 | | 35 day EMA | 106.17 | 105.66 | 105.14 | | 50 day EMA | 105.36 | 104.97 | 104.59 |
SMA (simple moving average) of Walmart Inc WMT
| SMA period | SMA current | SMA prev | SMA prev2 | | 5 day SMA | 112.74 | 111.59 | 110.11 | | 12 day SMA | 108.19 | 107.2 | 106.21 | | 20 day SMA | 106 | 105.33 | 104.72 | | 35 day SMA | 105.31 | 105.15 | 104.94 | | 50 day SMA | 104.69 | 104.45 | 104.21 | | 100 day SMA | 102.23 | 102.03 | 101.85 | | 150 day SMA | 100.54 | 100.42 | 100.3 | | 200 day SMA | 98.22 | 98.16 | 98.11 |
|
|
