WesternAsset WIW full analysis,charts,indicators,moving averages,SMA,DMA,EMA,ADX,MACD,RSIWestern Asset WIW WideScreen charts, DMA,SMA,EMA technical analysis, forecast prediction, by indicators ADX,MACD,RSI,CCI USA stock exchange
operates under N A sector & deals in N A
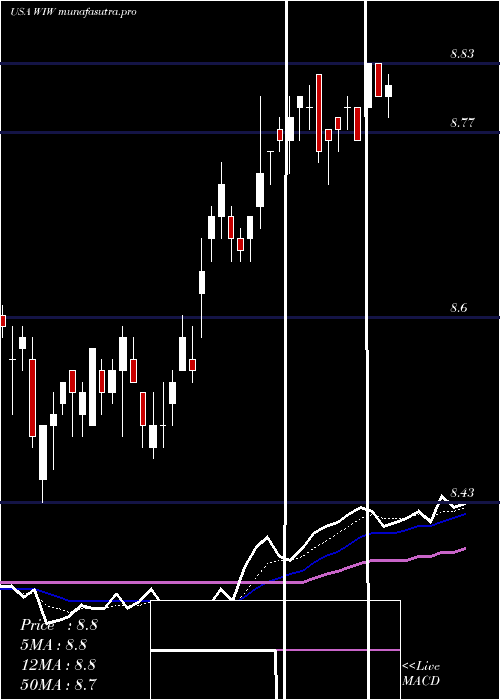
Daily price and charts and targets WesternAsset Strong Daily Stock price targets for WesternAsset WIW are 8.96 and 9.01 | Daily Target 1 | 8.92 | | Daily Target 2 | 8.95 | | Daily Target 3 | 8.9733333333333 | | Daily Target 4 | 9 | | Daily Target 5 | 9.02 |
Daily price and volume Western Asset
| Date |
Closing |
Open |
Range |
Volume |
Mon 20 October 2025 |
8.97 (0.67%) |
8.95 |
8.95 - 9.00 |
2.2812 times |
Fri 17 October 2025 |
8.91 (-0.89%) |
9.00 |
8.91 - 9.01 |
0.7366 times |
Thu 16 October 2025 |
8.99 (0.45%) |
8.98 |
8.95 - 8.99 |
0.737 times |
Wed 15 October 2025 |
8.95 (0%) |
8.99 |
8.94 - 9.00 |
0.6089 times |
Tue 14 October 2025 |
8.95 (-0.11%) |
8.97 |
8.94 - 9.02 |
0.8185 times |
Mon 13 October 2025 |
8.96 (0.11%) |
8.95 |
8.93 - 8.98 |
1.0898 times |
Tue 07 October 2025 |
8.95 (0.34%) |
8.93 |
8.91 - 8.97 |
1.5337 times |
Mon 06 October 2025 |
8.92 (0.56%) |
8.89 |
8.88 - 8.94 |
0.5877 times |
Fri 03 October 2025 |
8.87 (0%) |
8.86 |
8.86 - 8.91 |
0.8712 times |
Thu 02 October 2025 |
8.87 (-0.67%) |
8.91 |
8.85 - 8.94 |
0.7355 times |
Wed 01 October 2025 |
8.93 (0.45%) |
8.93 |
8.85 - 8.93 |
0.7645 times |
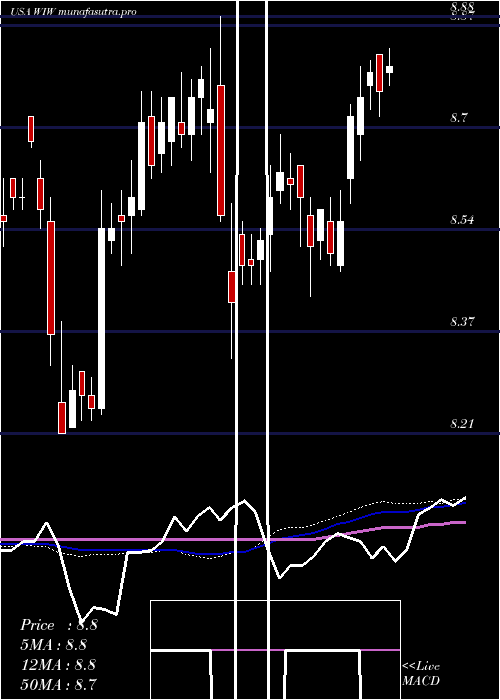
Weekly price and charts WesternAsset Strong weekly Stock price targets for WesternAsset WIW are 8.96 and 9.01 | Weekly Target 1 | 8.92 | | Weekly Target 2 | 8.95 | | Weekly Target 3 | 8.9733333333333 | | Weekly Target 4 | 9 | | Weekly Target 5 | 9.02 |
Weekly price and volumes for Western Asset
| Date |
Closing |
Open |
Range |
Volume |
Mon 20 October 2025 |
8.97 (0.67%) |
8.95 |
8.95 - 9.00 |
0.5568 times |
Fri 17 October 2025 |
8.91 (-0.45%) |
8.95 |
8.91 - 9.02 |
0.9742 times |
Tue 07 October 2025 |
8.95 (0.9%) |
8.89 |
8.88 - 8.97 |
0.5178 times |
Fri 03 October 2025 |
8.87 (-0.11%) |
8.89 |
8.85 - 8.94 |
0.9204 times |
Fri 26 September 2025 |
8.88 (-0.67%) |
8.98 |
8.85 - 8.98 |
0.7029 times |
Fri 19 September 2025 |
8.94 (0.45%) |
8.92 |
8.90 - 9.03 |
1.3581 times |
Fri 12 September 2025 |
8.90 (-0.11%) |
8.92 |
8.87 - 8.97 |
1.2277 times |
Fri 05 September 2025 |
8.91 (-0.34%) |
8.88 |
8.80 - 8.94 |
1.3687 times |
Fri 29 August 2025 |
8.94 (0%) |
8.98 |
8.94 - 8.99 |
0.2187 times |
Fri 29 August 2025 |
8.94 (0.34%) |
8.91 |
8.85 - 9.03 |
2.1545 times |
Fri 22 August 2025 |
8.91 (1.6%) |
8.76 |
8.74 - 8.91 |
1.2114 times |
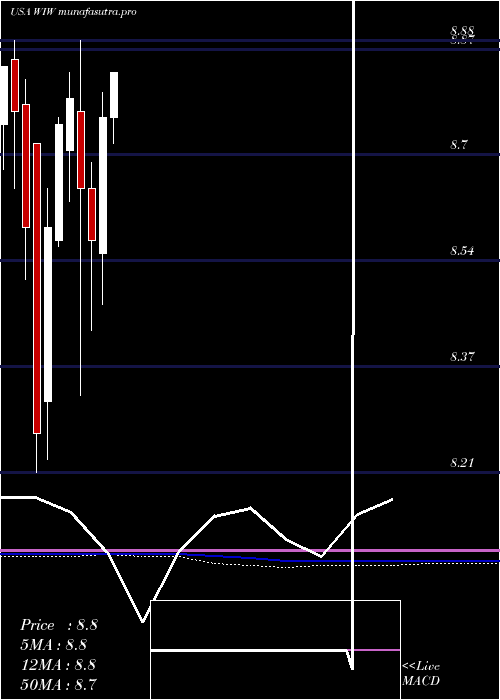
Monthly price and charts WesternAsset Strong monthly Stock price targets for WesternAsset WIW are 8.91 and 9.08 | Monthly Target 1 | 8.78 | | Monthly Target 2 | 8.87 | | Monthly Target 3 | 8.9466666666667 | | Monthly Target 4 | 9.04 | | Monthly Target 5 | 9.12 |
Monthly price and volumes Western Asset
| Date |
Closing |
Open |
Range |
Volume |
Mon 20 October 2025 |
8.97 (0.9%) |
8.93 |
8.85 - 9.02 |
0.5732 times |
Tue 30 September 2025 |
8.89 (-0.56%) |
8.88 |
8.80 - 9.03 |
1.0904 times |
Fri 29 August 2025 |
8.94 (1.94%) |
8.79 |
8.72 - 9.03 |
1.1423 times |
Thu 31 July 2025 |
8.77 (0.11%) |
8.76 |
8.65 - 8.84 |
1.0631 times |
Mon 30 June 2025 |
8.76 (2.22%) |
8.55 |
8.47 - 8.80 |
0.8589 times |
Fri 30 May 2025 |
8.57 (-0.92%) |
8.65 |
8.43 - 8.69 |
1.0259 times |
Wed 30 April 2025 |
8.65 (-1.59%) |
8.77 |
8.33 - 8.88 |
1.3081 times |
Mon 31 March 2025 |
8.79 (0.46%) |
8.71 |
8.63 - 8.83 |
0.885 times |
Fri 28 February 2025 |
8.75 (1.86%) |
8.57 |
8.56 - 8.76 |
0.7936 times |
Fri 31 January 2025 |
8.59 (3.87%) |
8.32 |
8.23 - 8.65 |
1.2595 times |
Tue 31 December 2024 |
8.27 (-3.73%) |
8.72 |
8.21 - 8.72 |
1.0593 times |
DMA SMA EMA moving averages of Western Asset WIW
DMA (daily moving average) of Western Asset WIW
| DMA period | DMA value | | 5 day DMA | 8.95 | | 12 day DMA | 8.93 | | 20 day DMA | 8.92 | | 35 day DMA | 8.92 | | 50 day DMA | 8.9 | | 100 day DMA | 8.79 | | 150 day DMA | 8.73 | | 200 day DMA | 8.69 | EMA (exponential moving average) of Western Asset WIW
| EMA period | EMA current | EMA prev | EMA prev2 | | 5 day EMA | 8.95 | 8.94 | 8.96 | | 12 day EMA | 8.94 | 8.93 | 8.93 | | 20 day EMA | 8.92 | 8.92 | 8.92 | | 35 day EMA | 8.89 | 8.89 | 8.89 | | 50 day EMA | 8.88 | 8.88 | 8.88 |
SMA (simple moving average) of Western Asset WIW
| SMA period | SMA current | SMA prev | SMA prev2 | | 5 day SMA | 8.95 | 8.95 | 8.96 | | 12 day SMA | 8.93 | 8.92 | 8.92 | | 20 day SMA | 8.92 | 8.93 | 8.93 | | 35 day SMA | 8.92 | 8.92 | 8.92 | | 50 day SMA | 8.9 | 8.9 | 8.89 | | 100 day SMA | 8.79 | 8.78 | 8.78 | | 150 day SMA | 8.73 | 8.73 | 8.73 | | 200 day SMA | 8.69 | 8.68 | 8.68 |
|
|
