WesternAsset WIA full analysis,charts,indicators,moving averages,SMA,DMA,EMA,ADX,MACD,RSIWestern Asset WIA WideScreen charts, DMA,SMA,EMA technical analysis, forecast prediction, by indicators ADX,MACD,RSI,CCI USA stock exchange
operates under N A sector & deals in N A
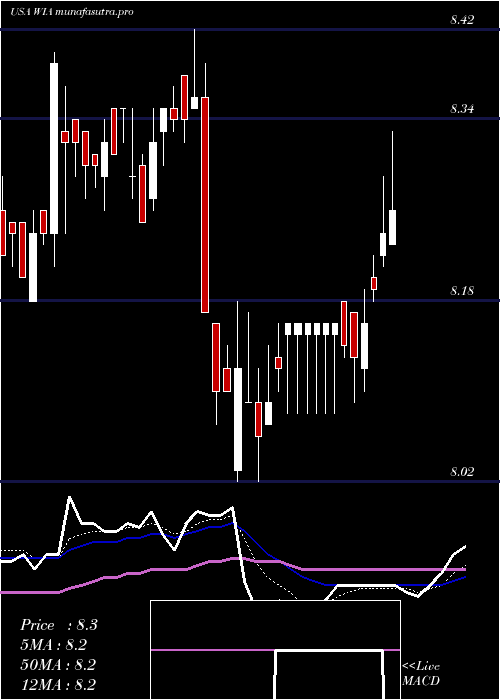
Daily price and charts and targets WesternAsset Strong Daily Stock price targets for WesternAsset WIA are 8.5 and 8.54 | Daily Target 1 | 8.46 | | Daily Target 2 | 8.49 | | Daily Target 3 | 8.5033333333333 | | Daily Target 4 | 8.53 | | Daily Target 5 | 8.54 |
Daily price and volume Western Asset
| Date |
Closing |
Open |
Range |
Volume |
Tue 21 October 2025 |
8.51 (0.35%) |
8.50 |
8.48 - 8.52 |
2.1173 times |
Mon 20 October 2025 |
8.48 (0%) |
8.48 |
8.46 - 8.50 |
1.1576 times |
Fri 17 October 2025 |
8.48 (0.12%) |
8.46 |
8.46 - 8.50 |
0.295 times |
Thu 16 October 2025 |
8.47 (0%) |
8.47 |
8.44 - 8.52 |
0.5601 times |
Wed 15 October 2025 |
8.47 (-0.24%) |
8.48 |
8.45 - 8.51 |
0.8626 times |
Tue 14 October 2025 |
8.49 (0.24%) |
8.47 |
8.41 - 8.52 |
0.702 times |
Mon 13 October 2025 |
8.47 (-0.24%) |
8.49 |
8.41 - 8.49 |
1.2285 times |
Fri 10 October 2025 |
8.49 (-0.24%) |
8.51 |
8.48 - 8.51 |
0.9821 times |
Thu 09 October 2025 |
8.51 (0.71%) |
8.47 |
8.47 - 8.51 |
0.6796 times |
Wed 08 October 2025 |
8.45 (-0.59%) |
8.51 |
8.44 - 8.51 |
1.4152 times |
Tue 07 October 2025 |
8.50 (0.83%) |
8.46 |
8.44 - 8.51 |
1.053 times |
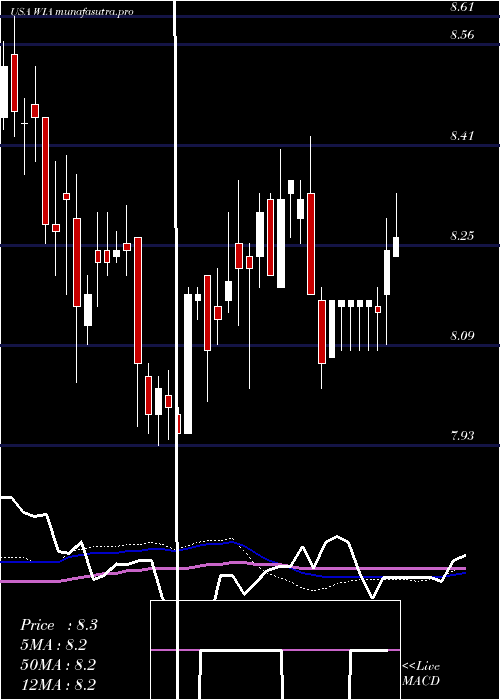
Weekly price and charts WesternAsset Strong weekly Stock price targets for WesternAsset WIA are 8.49 and 8.55 | Weekly Target 1 | 8.44 | | Weekly Target 2 | 8.47 | | Weekly Target 3 | 8.4966666666667 | | Weekly Target 4 | 8.53 | | Weekly Target 5 | 8.56 |
Weekly price and volumes for Western Asset
| Date |
Closing |
Open |
Range |
Volume |
Tue 21 October 2025 |
8.51 (0.35%) |
8.48 |
8.46 - 8.52 |
0.4251 times |
Fri 17 October 2025 |
8.48 (-0.12%) |
8.49 |
8.41 - 8.52 |
0.4735 times |
Fri 10 October 2025 |
8.49 (0.47%) |
8.43 |
8.43 - 8.51 |
0.7683 times |
Fri 03 October 2025 |
8.45 (0.84%) |
8.41 |
8.36 - 8.45 |
0.9489 times |
Fri 26 September 2025 |
8.38 (-0.71%) |
8.45 |
8.33 - 8.45 |
0.9296 times |
Fri 19 September 2025 |
8.44 (0.12%) |
8.45 |
8.40 - 8.49 |
1.4962 times |
Fri 12 September 2025 |
8.43 (0.36%) |
8.43 |
8.39 - 8.45 |
1.8341 times |
Fri 05 September 2025 |
8.40 (-0.24%) |
8.40 |
8.25 - 8.44 |
1.6213 times |
Fri 29 August 2025 |
8.42 (0%) |
8.50 |
8.40 - 8.50 |
0.2966 times |
Fri 29 August 2025 |
8.42 (0.84%) |
8.37 |
8.34 - 8.50 |
1.2064 times |
Fri 22 August 2025 |
8.35 (-0.24%) |
8.35 |
8.29 - 8.41 |
0.6388 times |
Monthly price and charts WesternAsset Strong monthly Stock price targets for WesternAsset WIA are 8.46 and 8.58 | Monthly Target 1 | 8.36 | | Monthly Target 2 | 8.43 | | Monthly Target 3 | 8.4766666666667 | | Monthly Target 4 | 8.55 | | Monthly Target 5 | 8.6 |
Monthly price and volumes Western Asset
| Date |
Closing |
Open |
Range |
Volume |
Tue 21 October 2025 |
8.51 (1.07%) |
8.44 |
8.40 - 8.52 |
0.6759 times |
Tue 30 September 2025 |
8.42 (0%) |
8.40 |
8.25 - 8.49 |
1.8532 times |
Fri 29 August 2025 |
8.42 (1.08%) |
8.26 |
8.26 - 8.50 |
1.2766 times |
Thu 31 July 2025 |
8.33 (-0.83%) |
8.42 |
8.25 - 8.44 |
1.0496 times |
Mon 30 June 2025 |
8.40 (2.56%) |
8.19 |
8.12 - 8.46 |
0.8483 times |
Fri 30 May 2025 |
8.19 (-1.44%) |
8.33 |
8.10 - 8.36 |
0.644 times |
Wed 30 April 2025 |
8.31 (-0.48%) |
8.35 |
8.02 - 8.42 |
0.936 times |
Mon 31 March 2025 |
8.35 (0.6%) |
8.32 |
8.18 - 8.40 |
0.7757 times |
Fri 28 February 2025 |
8.30 (2.09%) |
8.16 |
8.02 - 8.35 |
0.9438 times |
Fri 31 January 2025 |
8.13 (1.63%) |
8.02 |
7.94 - 8.21 |
0.997 times |
Tue 31 December 2024 |
8.00 (-2.68%) |
8.23 |
7.93 - 8.31 |
1.1281 times |

DMA SMA EMA moving averages of Western Asset WIA
DMA (daily moving average) of Western Asset WIA
| DMA period | DMA value | | 5 day DMA | 8.48 | | 12 day DMA | 8.48 | | 20 day DMA | 8.45 | | 35 day DMA | 8.44 | | 50 day DMA | 8.42 | | 100 day DMA | 8.37 | | 150 day DMA | 8.31 | | 200 day DMA | 8.28 | EMA (exponential moving average) of Western Asset WIA
| EMA period | EMA current | EMA prev | EMA prev2 | | 5 day EMA | 8.49 | 8.48 | 8.48 | | 12 day EMA | 8.46 | 8.45 | 8.45 | | 20 day EMA | 8.45 | 8.44 | 8.44 | | 35 day EMA | 8.43 | 8.42 | 8.42 | | 50 day EMA | 8.41 | 8.41 | 8.41 |
SMA (simple moving average) of Western Asset WIA
| SMA period | SMA current | SMA prev | SMA prev2 | | 5 day SMA | 8.48 | 8.48 | 8.48 | | 12 day SMA | 8.48 | 8.47 | 8.47 | | 20 day SMA | 8.45 | 8.44 | 8.44 | | 35 day SMA | 8.44 | 8.43 | 8.43 | | 50 day SMA | 8.42 | 8.42 | 8.42 | | 100 day SMA | 8.37 | 8.36 | 8.36 | | 150 day SMA | 8.31 | 8.31 | 8.31 | | 200 day SMA | 8.28 | 8.28 | 8.28 |
|
|
