WheelerReal WHLRD full analysis,charts,indicators,moving averages,SMA,DMA,EMA,ADX,MACD,RSIWheeler Real WHLRD WideScreen charts, DMA,SMA,EMA technical analysis, forecast prediction, by indicators ADX,MACD,RSI,CCI USA stock exchange
operates under Consumer Services sector & deals in Real Estate Investment Trusts
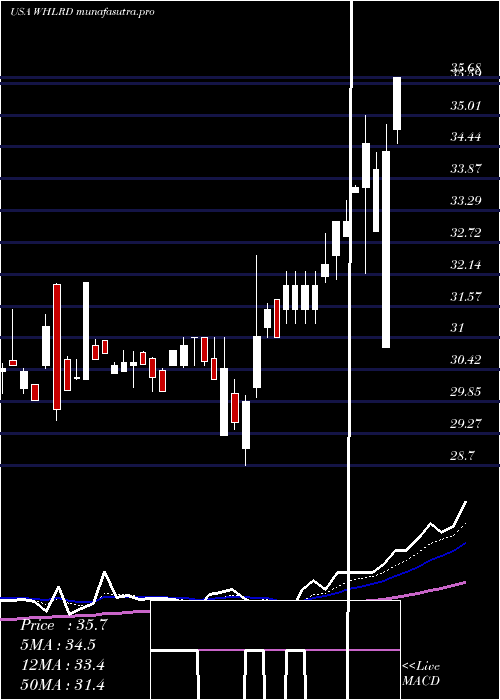
Daily price and charts and targets WheelerReal Strong Daily Stock price targets for WheelerReal WHLRD are 36.02 and 36.41 | Daily Target 1 | 35.75 | | Daily Target 2 | 35.89 | | Daily Target 3 | 36.14 | | Daily Target 4 | 36.28 | | Daily Target 5 | 36.53 |
Daily price and volume Wheeler Real
| Date |
Closing |
Open |
Range |
Volume |
Fri 17 October 2025 |
36.03 (-0.69%) |
36.00 |
36.00 - 36.39 |
0.6123 times |
Thu 16 October 2025 |
36.28 (0.81%) |
36.43 |
36.25 - 37.49 |
0.5248 times |
Wed 15 October 2025 |
35.99 (0.08%) |
35.99 |
35.99 - 35.99 |
0.0875 times |
Tue 14 October 2025 |
35.96 (0.17%) |
35.49 |
35.49 - 36.43 |
2.7117 times |
Mon 13 October 2025 |
35.90 (-0.5%) |
36.00 |
35.60 - 36.06 |
4.1987 times |
Fri 10 October 2025 |
36.08 (2.18%) |
35.98 |
35.47 - 36.08 |
0.5248 times |
Thu 09 October 2025 |
35.31 (-0.2%) |
35.43 |
35.31 - 35.43 |
0.3499 times |
Wed 08 October 2025 |
35.38 (-1.72%) |
35.38 |
35.38 - 35.38 |
0.0875 times |
Tue 07 October 2025 |
36.00 (0.84%) |
35.71 |
35.67 - 36.11 |
0.7873 times |
Thu 02 October 2025 |
35.70 (0.06%) |
35.70 |
35.70 - 35.70 |
0.1155 times |
Wed 01 October 2025 |
35.68 (-2.86%) |
35.36 |
35.15 - 35.90 |
0.8747 times |
Weekly price and charts WheelerReal Strong weekly Stock price targets for WheelerReal WHLRD are 35.76 and 37.76 | Weekly Target 1 | 34.34 | | Weekly Target 2 | 35.18 | | Weekly Target 3 | 36.336666666667 | | Weekly Target 4 | 37.18 | | Weekly Target 5 | 38.34 |
Weekly price and volumes for Wheeler Real
| Date |
Closing |
Open |
Range |
Volume |
Fri 17 October 2025 |
36.03 (-0.14%) |
36.00 |
35.49 - 37.49 |
0.9704 times |
Fri 10 October 2025 |
36.08 (1.06%) |
35.71 |
35.31 - 36.11 |
0.2087 times |
Thu 02 October 2025 |
35.70 (-1.49%) |
36.25 |
35.02 - 36.73 |
0.6399 times |
Tue 23 September 2025 |
36.24 (-0.25%) |
36.75 |
36.24 - 36.75 |
0.0939 times |
Fri 19 September 2025 |
36.33 (-3.3%) |
35.50 |
35.01 - 38.18 |
3.9027 times |
Fri 12 September 2025 |
37.57 (5.53%) |
35.50 |
35.25 - 38.08 |
2.3061 times |
Fri 05 September 2025 |
35.60 (1.14%) |
36.00 |
35.02 - 36.22 |
0.2713 times |
Fri 29 August 2025 |
35.20 (0%) |
35.50 |
35.20 - 35.70 |
0.1461 times |
Fri 29 August 2025 |
35.20 (0.03%) |
35.60 |
35.14 - 36.09 |
0.6574 times |
Fri 22 August 2025 |
35.19 (1.32%) |
34.99 |
34.85 - 35.50 |
0.8035 times |
Fri 15 August 2025 |
34.73 (0.14%) |
35.43 |
34.15 - 35.45 |
0.9078 times |

Monthly price and charts WheelerReal Strong monthly Stock price targets for WheelerReal WHLRD are 35.59 and 37.93 | Monthly Target 1 | 33.88 | | Monthly Target 2 | 34.96 | | Monthly Target 3 | 36.223333333333 | | Monthly Target 4 | 37.3 | | Monthly Target 5 | 38.56 |
Monthly price and volumes Wheeler Real
| Date |
Closing |
Open |
Range |
Volume |
Fri 17 October 2025 |
36.03 (-1.91%) |
35.36 |
35.15 - 37.49 |
0.1547 times |
Tue 30 September 2025 |
36.73 (4.35%) |
36.00 |
35.01 - 38.18 |
0.846 times |
Fri 29 August 2025 |
35.20 (3.17%) |
34.78 |
33.25 - 36.09 |
0.4367 times |
Wed 30 July 2025 |
34.12 (-0.18%) |
34.95 |
33.66 - 35.50 |
0.5256 times |
Mon 30 June 2025 |
34.18 (0.53%) |
34.00 |
32.26 - 34.99 |
0.7055 times |
Fri 30 May 2025 |
34.00 (-4.71%) |
35.48 |
33.00 - 35.74 |
0.53 times |
Wed 30 April 2025 |
35.68 (15.96%) |
30.50 |
28.70 - 35.68 |
1.6775 times |
Mon 31 March 2025 |
30.77 (0.23%) |
30.38 |
29.51 - 31.99 |
0.8732 times |
Thu 27 February 2025 |
30.70 (-4.06%) |
31.50 |
29.92 - 32.12 |
0.4852 times |
Fri 31 January 2025 |
32.00 (17.91%) |
27.09 |
25.25 - 34.01 |
3.7656 times |
Tue 31 December 2024 |
27.14 (8%) |
26.00 |
24.05 - 27.26 |
6.4593 times |

DMA SMA EMA moving averages of Wheeler Real WHLRD
DMA (daily moving average) of Wheeler Real WHLRD
| DMA period | DMA value | | 5 day DMA | 36.03 | | 12 day DMA | 35.92 | | 20 day DMA | 36.26 | | 35 day DMA | 35.88 | | 50 day DMA | 35.47 | | 100 day DMA | 34.74 | | 150 day DMA | 33.42 | | 200 day DMA | 31.93 | EMA (exponential moving average) of Wheeler Real WHLRD
| EMA period | EMA current | EMA prev | EMA prev2 | | 5 day EMA | 36.03 | 36.03 | 35.91 | | 12 day EMA | 36.01 | 36.01 | 35.96 | | 20 day EMA | 35.98 | 35.97 | 35.94 | | 35 day EMA | 35.74 | 35.72 | 35.69 | | 50 day EMA | 35.42 | 35.4 | 35.36 |
SMA (simple moving average) of Wheeler Real WHLRD
| SMA period | SMA current | SMA prev | SMA prev2 | | 5 day SMA | 36.03 | 36.04 | 35.85 | | 12 day SMA | 35.92 | 35.95 | 35.95 | | 20 day SMA | 36.26 | 36.27 | 36.25 | | 35 day SMA | 35.88 | 35.85 | 35.8 | | 50 day SMA | 35.47 | 35.43 | 35.38 | | 100 day SMA | 34.74 | 34.7 | 34.66 | | 150 day SMA | 33.42 | 33.4 | 33.37 | | 200 day SMA | 31.93 | 31.89 | 31.84 |
|
|
