WestwoodHoldings WHG full analysis,charts,indicators,moving averages,SMA,DMA,EMA,ADX,MACD,RSIWestwood Holdings WHG WideScreen charts, DMA,SMA,EMA technical analysis, forecast prediction, by indicators ADX,MACD,RSI,CCI USA stock exchange
operates under Finance sector & deals in Investment Managers
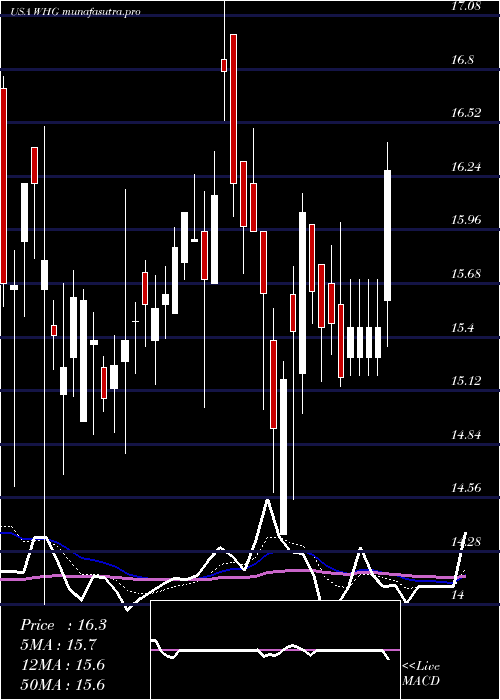
Daily price and charts and targets WestwoodHoldings Strong Daily Stock price targets for WestwoodHoldings WHG are 16.21 and 16.49 | Daily Target 1 | 16.12 | | Daily Target 2 | 16.3 | | Daily Target 3 | 16.4 | | Daily Target 4 | 16.58 | | Daily Target 5 | 16.68 |
Daily price and volume Westwood Holdings
| Date |
Closing |
Open |
Range |
Volume |
Mon 20 October 2025 |
16.48 (0.24%) |
16.50 |
16.22 - 16.50 |
0.7795 times |
Fri 17 October 2025 |
16.44 (0.8%) |
16.23 |
16.23 - 16.44 |
0.8445 times |
Thu 16 October 2025 |
16.31 (-1.15%) |
16.50 |
16.15 - 16.50 |
0.7471 times |
Wed 15 October 2025 |
16.50 (0%) |
16.50 |
16.24 - 16.50 |
0.812 times |
Tue 14 October 2025 |
16.50 (0.79%) |
16.28 |
16.24 - 16.50 |
0.9257 times |
Mon 13 October 2025 |
16.37 (-1.21%) |
16.47 |
16.22 - 16.47 |
2.5173 times |
Tue 07 October 2025 |
16.57 (-0.3%) |
16.38 |
16.38 - 16.57 |
0.9095 times |
Mon 06 October 2025 |
16.62 (-0.3%) |
16.66 |
16.36 - 16.66 |
0.6145 times |
Fri 03 October 2025 |
16.67 (1.03%) |
16.66 |
16.62 - 16.78 |
0.9257 times |
Thu 02 October 2025 |
16.50 (0%) |
16.41 |
16.37 - 16.63 |
0.9241 times |
Wed 01 October 2025 |
16.50 (0.06%) |
16.56 |
16.40 - 17.02 |
0.9257 times |
Weekly price and charts WestwoodHoldings Strong weekly Stock price targets for WestwoodHoldings WHG are 16.21 and 16.49 | Weekly Target 1 | 16.12 | | Weekly Target 2 | 16.3 | | Weekly Target 3 | 16.4 | | Weekly Target 4 | 16.58 | | Weekly Target 5 | 16.68 |
Weekly price and volumes for Westwood Holdings
| Date |
Closing |
Open |
Range |
Volume |
Mon 20 October 2025 |
16.48 (0.24%) |
16.50 |
16.22 - 16.50 |
0.1222 times |
Fri 17 October 2025 |
16.44 (-0.78%) |
16.47 |
16.15 - 16.50 |
0.9163 times |
Tue 07 October 2025 |
16.57 (-0.6%) |
16.66 |
16.36 - 16.66 |
0.2389 times |
Fri 03 October 2025 |
16.67 (-1.3%) |
16.82 |
16.37 - 17.02 |
0.6921 times |
Fri 26 September 2025 |
16.89 (-4.36%) |
17.46 |
16.37 - 17.50 |
1.2599 times |
Fri 19 September 2025 |
17.66 (3.58%) |
16.75 |
16.61 - 17.66 |
3.0621 times |
Fri 12 September 2025 |
17.05 (-1.67%) |
17.50 |
17.00 - 17.50 |
0.6338 times |
Fri 05 September 2025 |
17.34 (-2.36%) |
17.17 |
16.95 - 17.51 |
1.041 times |
Fri 29 August 2025 |
17.76 (0%) |
18.15 |
17.14 - 18.15 |
0.4098 times |
Fri 29 August 2025 |
17.76 (-5.33%) |
18.89 |
17.14 - 18.97 |
1.6239 times |
Fri 22 August 2025 |
18.76 (4.51%) |
17.82 |
17.27 - 18.88 |
1.1989 times |

Monthly price and charts WestwoodHoldings Strong monthly Stock price targets for WestwoodHoldings WHG are 15.88 and 16.75 | Monthly Target 1 | 15.68 | | Monthly Target 2 | 16.08 | | Monthly Target 3 | 16.55 | | Monthly Target 4 | 16.95 | | Monthly Target 5 | 17.42 |
Monthly price and volumes Westwood Holdings
| Date |
Closing |
Open |
Range |
Volume |
Mon 20 October 2025 |
16.48 (-0.06%) |
16.56 |
16.15 - 17.02 |
0.1586 times |
Tue 30 September 2025 |
16.49 (-7.15%) |
17.17 |
16.37 - 17.66 |
0.5791 times |
Fri 29 August 2025 |
17.76 (1.6%) |
17.56 |
16.29 - 18.97 |
0.593 times |
Thu 31 July 2025 |
17.48 (12.05%) |
15.56 |
15.29 - 18.65 |
1.0594 times |
Mon 30 June 2025 |
15.60 (5.48%) |
14.72 |
14.51 - 16.48 |
3.7854 times |
Fri 30 May 2025 |
14.79 (-11.44%) |
16.50 |
14.51 - 17.73 |
0.842 times |
Wed 30 April 2025 |
16.70 (3.09%) |
16.32 |
14.37 - 16.94 |
0.6506 times |
Mon 31 March 2025 |
16.20 (2.53%) |
15.46 |
14.68 - 17.25 |
0.8675 times |
Fri 28 February 2025 |
15.80 (2.66%) |
15.26 |
14.00 - 17.36 |
0.8511 times |
Fri 31 January 2025 |
15.39 (6.06%) |
15.04 |
14.09 - 16.15 |
0.6134 times |
Tue 31 December 2024 |
14.51 (-10.21%) |
15.60 |
13.49 - 16.00 |
0.5375 times |

DMA SMA EMA moving averages of Westwood Holdings WHG
DMA (daily moving average) of Westwood Holdings WHG
| DMA period | DMA value | | 5 day DMA | 16.45 | | 12 day DMA | 16.5 | | 20 day DMA | 16.73 | | 35 day DMA | 16.99 | | 50 day DMA | 17.24 | | 100 day DMA | 16.69 | | 150 day DMA | 16.37 | | 200 day DMA | 16.14 | EMA (exponential moving average) of Westwood Holdings WHG
| EMA period | EMA current | EMA prev | EMA prev2 | | 5 day EMA | 16.45 | 16.44 | 16.44 | | 12 day EMA | 16.56 | 16.57 | 16.59 | | 20 day EMA | 16.69 | 16.71 | 16.74 | | 35 day EMA | 16.94 | 16.97 | 17 | | 50 day EMA | 17.18 | 17.21 | 17.24 |
SMA (simple moving average) of Westwood Holdings WHG
| SMA period | SMA current | SMA prev | SMA prev2 | | 5 day SMA | 16.45 | 16.42 | 16.45 | | 12 day SMA | 16.5 | 16.5 | 16.54 | | 20 day SMA | 16.73 | 16.74 | 16.77 | | 35 day SMA | 16.99 | 17.03 | 17.08 | | 50 day SMA | 17.24 | 17.26 | 17.28 | | 100 day SMA | 16.69 | 16.68 | 16.66 | | 150 day SMA | 16.37 | 16.37 | 16.36 | | 200 day SMA | 16.14 | 16.13 | 16.12 |
|
|
