CactusInc WHD full analysis,charts,indicators,moving averages,SMA,DMA,EMA,ADX,MACD,RSICactus Inc WHD WideScreen charts, DMA,SMA,EMA technical analysis, forecast prediction, by indicators ADX,MACD,RSI,CCI USA stock exchange
operates under Energy sector & deals in Metal Fabrications
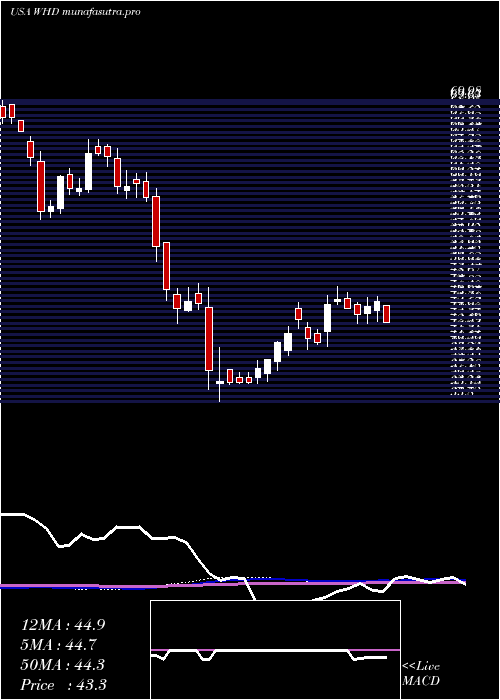
Daily price and charts and targets CactusInc Strong Daily Stock price targets for CactusInc WHD are 37.03 and 37.8 | Daily Target 1 | 36.44 | | Daily Target 2 | 36.84 | | Daily Target 3 | 37.206666666667 | | Daily Target 4 | 37.61 | | Daily Target 5 | 37.98 |
Daily price and volume Cactus Inc
| Date |
Closing |
Open |
Range |
Volume |
Mon 20 October 2025 |
37.25 (1.75%) |
36.90 |
36.80 - 37.57 |
0.7866 times |
Fri 17 October 2025 |
36.61 (2.81%) |
35.42 |
35.21 - 37.00 |
1.397 times |
Thu 16 October 2025 |
35.61 (0.99%) |
35.53 |
34.81 - 35.62 |
1.2047 times |
Wed 15 October 2025 |
35.26 (0%) |
35.65 |
35.07 - 36.05 |
0.8727 times |
Tue 14 October 2025 |
35.26 (0.69%) |
34.47 |
33.90 - 35.55 |
0.8279 times |
Mon 13 October 2025 |
35.02 (-3.9%) |
34.27 |
33.30 - 35.07 |
1.3513 times |
Tue 07 October 2025 |
36.44 (-2.15%) |
37.02 |
36.14 - 37.36 |
0.7182 times |
Mon 06 October 2025 |
37.24 (-0.93%) |
37.85 |
37.10 - 38.12 |
0.7042 times |
Fri 03 October 2025 |
37.59 (-1.65%) |
38.67 |
37.53 - 38.90 |
1.3883 times |
Thu 02 October 2025 |
38.22 (-4.64%) |
39.85 |
38.08 - 40.24 |
0.7491 times |
Wed 01 October 2025 |
40.08 (1.55%) |
39.23 |
39.22 - 40.27 |
0.8194 times |

Weekly price and charts CactusInc Strong weekly Stock price targets for CactusInc WHD are 37.03 and 37.8 | Weekly Target 1 | 36.44 | | Weekly Target 2 | 36.84 | | Weekly Target 3 | 37.206666666667 | | Weekly Target 4 | 37.61 | | Weekly Target 5 | 37.98 |
Weekly price and volumes for Cactus Inc
| Date |
Closing |
Open |
Range |
Volume |
Mon 20 October 2025 |
37.25 (1.75%) |
36.90 |
36.80 - 37.57 |
0.2019 times |
Fri 17 October 2025 |
36.61 (0.47%) |
34.27 |
33.30 - 37.00 |
1.4511 times |
Tue 07 October 2025 |
36.44 (-3.06%) |
37.85 |
36.14 - 38.12 |
0.3651 times |
Fri 03 October 2025 |
37.59 (-9.51%) |
41.26 |
37.53 - 41.40 |
1.1848 times |
Fri 26 September 2025 |
41.54 (5.22%) |
39.35 |
38.99 - 42.05 |
1.3449 times |
Fri 19 September 2025 |
39.48 (-1.2%) |
40.28 |
39.33 - 41.59 |
1.6139 times |
Fri 12 September 2025 |
39.96 (-6.61%) |
43.07 |
39.95 - 43.07 |
1.474 times |
Fri 05 September 2025 |
42.79 (2%) |
41.62 |
39.86 - 43.70 |
1.0495 times |
Fri 29 August 2025 |
41.95 (0%) |
41.74 |
41.74 - 42.30 |
0.2263 times |
Fri 29 August 2025 |
41.95 (-0.92%) |
42.12 |
40.35 - 42.36 |
1.0885 times |
Fri 22 August 2025 |
42.34 (6.62%) |
39.94 |
38.63 - 42.46 |
1.0607 times |
Monthly price and charts CactusInc Strong monthly Stock price targets for CactusInc WHD are 31.79 and 38.76 | Monthly Target 1 | 29.97 | | Monthly Target 2 | 33.61 | | Monthly Target 3 | 36.94 | | Monthly Target 4 | 40.58 | | Monthly Target 5 | 43.91 |
Monthly price and volumes Cactus Inc
| Date |
Closing |
Open |
Range |
Volume |
Mon 20 October 2025 |
37.25 (-5.62%) |
39.23 |
33.30 - 40.27 |
0.5017 times |
Tue 30 September 2025 |
39.47 (-5.91%) |
41.62 |
38.60 - 43.70 |
1.0674 times |
Fri 29 August 2025 |
41.95 (-0.85%) |
41.72 |
37.87 - 42.46 |
1.0361 times |
Thu 31 July 2025 |
42.31 (-3.23%) |
43.61 |
41.09 - 48.35 |
0.8888 times |
Mon 30 June 2025 |
43.72 (6.63%) |
42.24 |
40.47 - 47.62 |
0.9882 times |
Fri 30 May 2025 |
41.00 (8.07%) |
40.98 |
38.16 - 45.70 |
0.9905 times |
Wed 30 April 2025 |
37.94 (-17.22%) |
45.56 |
33.80 - 47.50 |
1.6431 times |
Mon 31 March 2025 |
45.83 (-12.77%) |
53.00 |
43.27 - 53.00 |
1.3806 times |
Fri 28 February 2025 |
52.54 (-12.01%) |
59.23 |
50.73 - 61.66 |
0.7576 times |
Fri 31 January 2025 |
59.71 (2.31%) |
59.29 |
58.57 - 65.35 |
0.7461 times |
Tue 31 December 2024 |
58.36 (-14.1%) |
67.66 |
55.78 - 67.66 |
0.7606 times |
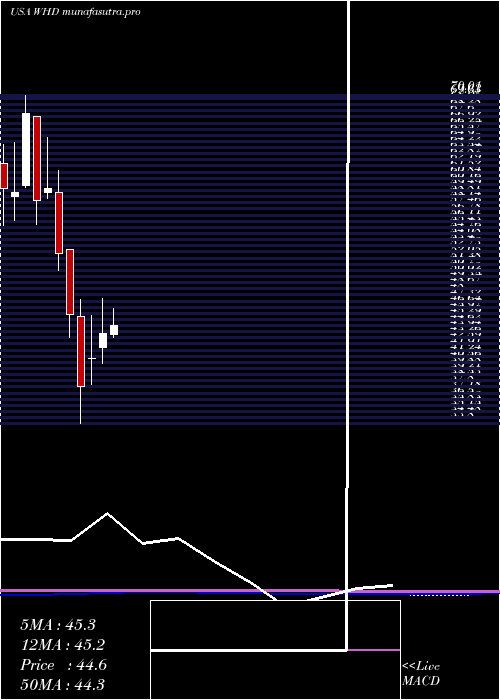
DMA SMA EMA moving averages of Cactus Inc WHD
DMA (daily moving average) of Cactus Inc WHD
| DMA period | DMA value | | 5 day DMA | 36 | | 12 day DMA | 37 | | 20 day DMA | 38.36 | | 35 day DMA | 39.64 | | 50 day DMA | 39.73 | | 100 day DMA | 42.01 | | 150 day DMA | 41.75 | | 200 day DMA | 45.9 | EMA (exponential moving average) of Cactus Inc WHD
| EMA period | EMA current | EMA prev | EMA prev2 | | 5 day EMA | 36.48 | 36.1 | 35.84 | | 12 day EMA | 37.08 | 37.05 | 37.13 | | 20 day EMA | 37.87 | 37.94 | 38.08 | | 35 day EMA | 38.75 | 38.84 | 38.97 | | 50 day EMA | 39.54 | 39.63 | 39.75 |
SMA (simple moving average) of Cactus Inc WHD
| SMA period | SMA current | SMA prev | SMA prev2 | | 5 day SMA | 36 | 35.55 | 35.52 | | 12 day SMA | 37 | 37.25 | 37.66 | | 20 day SMA | 38.36 | 38.51 | 38.71 | | 35 day SMA | 39.64 | 39.77 | 39.89 | | 50 day SMA | 39.73 | 39.78 | 39.86 | | 100 day SMA | 42.01 | 42.05 | 42.11 | | 150 day SMA | 41.75 | 41.81 | 41.86 | | 200 day SMA | 45.9 | 46 | 46.11 |
|
|
