WinnebagoIndustries WGO full analysis,charts,indicators,moving averages,SMA,DMA,EMA,ADX,MACD,RSIWinnebago Industries WGO WideScreen charts, DMA,SMA,EMA technical analysis, forecast prediction, by indicators ADX,MACD,RSI,CCI USA stock exchange
operates under Consumer Non Durables sector & deals in Homebuilding
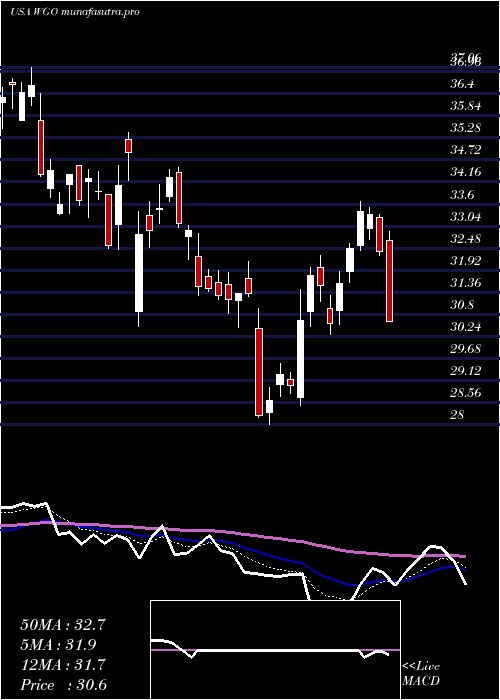
Daily price and charts and targets WinnebagoIndustries Strong Daily Stock price targets for WinnebagoIndustries WGO are 30.25 and 31.08 | Daily Target 1 | 29.6 | | Daily Target 2 | 30.06 | | Daily Target 3 | 30.433333333333 | | Daily Target 4 | 30.89 | | Daily Target 5 | 31.26 |
Daily price and volume Winnebago Industries
| Date |
Closing |
Open |
Range |
Volume |
Mon 20 October 2025 |
30.51 (1.5%) |
30.42 |
29.98 - 30.81 |
0.869 times |
Fri 17 October 2025 |
30.06 (0.27%) |
29.89 |
29.63 - 30.35 |
1.0998 times |
Thu 16 October 2025 |
29.98 (-0.46%) |
30.16 |
29.55 - 30.23 |
0.899 times |
Wed 15 October 2025 |
30.12 (-2.05%) |
30.89 |
29.71 - 31.18 |
1.0501 times |
Tue 14 October 2025 |
30.75 (2.98%) |
29.35 |
29.24 - 31.01 |
1.2721 times |
Mon 13 October 2025 |
29.86 (0.67%) |
30.07 |
29.68 - 30.34 |
1.0161 times |
Fri 10 October 2025 |
29.66 (-5.21%) |
31.64 |
29.65 - 31.64 |
1.1849 times |
Thu 09 October 2025 |
31.29 (-2.61%) |
31.90 |
31.16 - 31.94 |
1.0032 times |
Wed 08 October 2025 |
32.13 (0.06%) |
32.11 |
31.90 - 32.51 |
0.62 times |
Tue 07 October 2025 |
32.11 (-2.31%) |
32.82 |
31.90 - 33.25 |
0.9859 times |
Mon 06 October 2025 |
32.87 (-5.55%) |
35.09 |
32.85 - 35.10 |
0.7124 times |
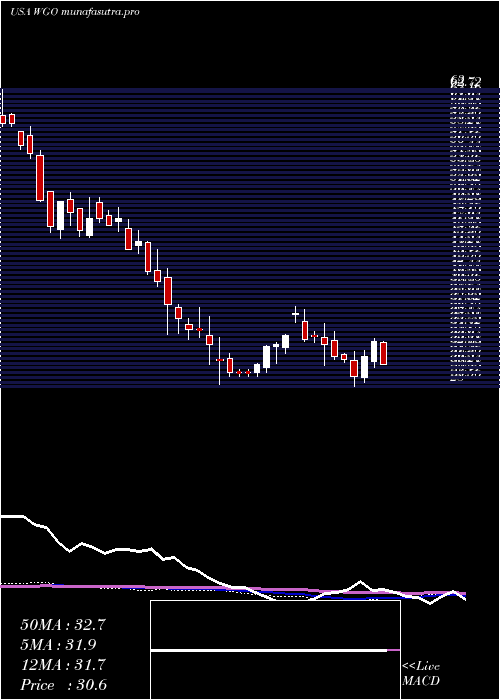
Weekly price and charts WinnebagoIndustries Strong weekly Stock price targets for WinnebagoIndustries WGO are 30.25 and 31.08 | Weekly Target 1 | 29.6 | | Weekly Target 2 | 30.06 | | Weekly Target 3 | 30.433333333333 | | Weekly Target 4 | 30.89 | | Weekly Target 5 | 31.26 |
Weekly price and volumes for Winnebago Industries
| Date |
Closing |
Open |
Range |
Volume |
Mon 20 October 2025 |
30.51 (1.5%) |
30.42 |
29.98 - 30.81 |
0.2219 times |
Fri 17 October 2025 |
30.06 (1.35%) |
30.07 |
29.24 - 31.18 |
1.3629 times |
Fri 10 October 2025 |
29.66 (-14.77%) |
35.09 |
29.65 - 35.10 |
1.1508 times |
Fri 03 October 2025 |
34.80 (0.87%) |
34.96 |
32.91 - 35.10 |
0.9544 times |
Fri 26 September 2025 |
34.50 (4.2%) |
33.00 |
32.85 - 34.75 |
1.2207 times |
Fri 19 September 2025 |
33.11 (-2.24%) |
34.14 |
32.72 - 34.97 |
1.759 times |
Fri 12 September 2025 |
33.87 (-7.94%) |
37.03 |
33.69 - 37.03 |
1.5274 times |
Fri 05 September 2025 |
36.79 (2.25%) |
35.34 |
34.78 - 37.68 |
0.7609 times |
Fri 29 August 2025 |
35.98 (0%) |
36.00 |
35.50 - 36.53 |
0.1569 times |
Fri 29 August 2025 |
35.98 (-0.77%) |
35.98 |
35.19 - 36.79 |
0.8852 times |
Fri 22 August 2025 |
36.26 (5.71%) |
34.37 |
33.12 - 36.43 |
1.4399 times |
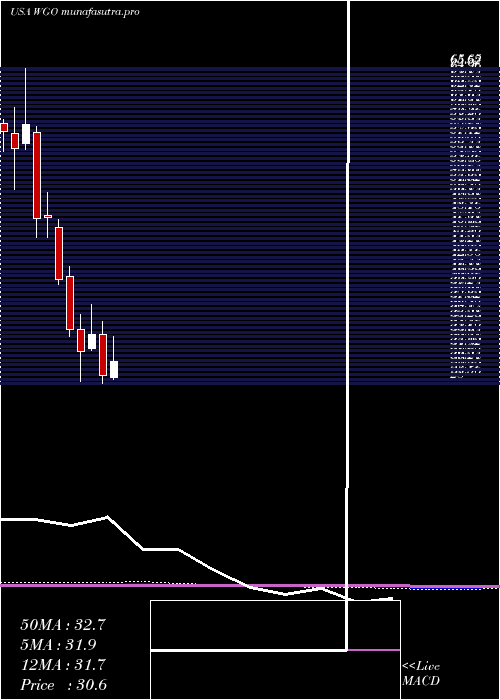
Monthly price and charts WinnebagoIndustries Strong monthly Stock price targets for WinnebagoIndustries WGO are 26.95 and 32.81 | Monthly Target 1 | 25.76 | | Monthly Target 2 | 28.13 | | Monthly Target 3 | 31.616666666667 | | Monthly Target 4 | 33.99 | | Monthly Target 5 | 37.48 |
Monthly price and volumes Winnebago Industries
| Date |
Closing |
Open |
Range |
Volume |
Mon 20 October 2025 |
30.51 (-8.76%) |
33.54 |
29.24 - 35.10 |
0.4585 times |
Tue 30 September 2025 |
33.44 (-7.06%) |
35.34 |
32.72 - 37.68 |
0.8057 times |
Fri 29 August 2025 |
35.98 (21.06%) |
29.51 |
28.40 - 36.79 |
0.7946 times |
Thu 31 July 2025 |
29.72 (2.48%) |
28.69 |
28.49 - 33.67 |
1.0724 times |
Mon 30 June 2025 |
29.00 (-14.53%) |
33.85 |
28.00 - 35.42 |
1.2119 times |
Fri 30 May 2025 |
33.93 (6.63%) |
32.15 |
31.92 - 37.47 |
0.6945 times |
Wed 30 April 2025 |
31.82 (-7.66%) |
34.50 |
28.29 - 36.26 |
1.1413 times |
Mon 31 March 2025 |
34.46 (-14.72%) |
40.85 |
33.59 - 41.98 |
1.7632 times |
Fri 28 February 2025 |
40.41 (-15.46%) |
46.60 |
39.83 - 47.64 |
0.823 times |
Fri 31 January 2025 |
47.80 (0.04%) |
48.03 |
45.51 - 50.82 |
1.2351 times |
Tue 31 December 2024 |
47.78 (-18.92%) |
58.02 |
45.44 - 58.68 |
1.0401 times |
DMA SMA EMA moving averages of Winnebago Industries WGO
DMA (daily moving average) of Winnebago Industries WGO
| DMA period | DMA value | | 5 day DMA | 30.28 | | 12 day DMA | 31.18 | | 20 day DMA | 32.25 | | 35 day DMA | 33.25 | | 50 day DMA | 33.8 | | 100 day DMA | 32.66 | | 150 day DMA | 32.88 | | 200 day DMA | 35.68 | EMA (exponential moving average) of Winnebago Industries WGO
| EMA period | EMA current | EMA prev | EMA prev2 | | 5 day EMA | 30.36 | 30.29 | 30.4 | | 12 day EMA | 31.08 | 31.18 | 31.38 | | 20 day EMA | 31.77 | 31.9 | 32.09 | | 35 day EMA | 32.52 | 32.64 | 32.79 | | 50 day EMA | 33.17 | 33.28 | 33.41 |
SMA (simple moving average) of Winnebago Industries WGO
| SMA period | SMA current | SMA prev | SMA prev2 | | 5 day SMA | 30.28 | 30.15 | 30.07 | | 12 day SMA | 31.18 | 31.47 | 31.78 | | 20 day SMA | 32.25 | 32.39 | 32.54 | | 35 day SMA | 33.25 | 33.4 | 33.57 | | 50 day SMA | 33.8 | 33.79 | 33.8 | | 100 day SMA | 32.66 | 32.69 | 32.73 | | 150 day SMA | 32.88 | 32.91 | 32.94 | | 200 day SMA | 35.68 | 35.77 | 35.86 |
|
|
