WellsFargo WFC full analysis,charts,indicators,moving averages,SMA,DMA,EMA,ADX,MACD,RSIWells Fargo WFC WideScreen charts, DMA,SMA,EMA technical analysis, forecast prediction, by indicators ADX,MACD,RSI,CCI USA stock exchange
operates under Finance sector & deals in Major Banks
Daily price and charts and targets WellsFargo Strong Daily Stock price targets for WellsFargo WFC are 84.56 and 87.61 | Daily Target 1 | 82.03 | | Daily Target 2 | 84.03 | | Daily Target 3 | 85.083333333333 | | Daily Target 4 | 87.08 | | Daily Target 5 | 88.13 |
Daily price and volume Wells Fargo
| Date |
Closing |
Open |
Range |
Volume |
Mon 20 October 2025 |
86.02 (3.29%) |
83.85 |
83.09 - 86.14 |
0.6102 times |
Fri 17 October 2025 |
83.28 (-0.56%) |
84.45 |
82.31 - 84.53 |
1.1293 times |
Thu 16 October 2025 |
83.75 (-3.13%) |
86.84 |
83.00 - 87.43 |
1.0827 times |
Wed 15 October 2025 |
86.46 (2.25%) |
85.17 |
85.16 - 87.47 |
1.3762 times |
Tue 14 October 2025 |
84.56 (7.15%) |
82.52 |
80.39 - 86.06 |
2.1783 times |
Mon 13 October 2025 |
78.92 (1.67%) |
78.74 |
78.28 - 79.23 |
0.8548 times |
Fri 10 October 2025 |
77.62 (-2.84%) |
79.61 |
77.62 - 80.44 |
0.9614 times |
Thu 09 October 2025 |
79.89 (0.2%) |
79.91 |
79.42 - 80.75 |
0.5065 times |
Wed 08 October 2025 |
79.73 (-1.74%) |
81.25 |
79.54 - 81.33 |
0.6775 times |
Tue 07 October 2025 |
81.14 (0.56%) |
80.87 |
80.54 - 81.36 |
0.623 times |
Mon 06 October 2025 |
80.69 (0.02%) |
81.00 |
79.57 - 81.46 |
0.592 times |
Weekly price and charts WellsFargo Strong weekly Stock price targets for WellsFargo WFC are 84.56 and 87.61 | Weekly Target 1 | 82.03 | | Weekly Target 2 | 84.03 | | Weekly Target 3 | 85.083333333333 | | Weekly Target 4 | 87.08 | | Weekly Target 5 | 88.13 |
Weekly price and volumes for Wells Fargo
| Date |
Closing |
Open |
Range |
Volume |
Mon 20 October 2025 |
86.02 (3.29%) |
83.85 |
83.09 - 86.14 |
0.1723 times |
Fri 17 October 2025 |
83.28 (7.29%) |
78.74 |
78.28 - 87.47 |
1.8702 times |
Fri 10 October 2025 |
77.62 (-3.78%) |
81.00 |
77.62 - 81.46 |
0.9492 times |
Fri 03 October 2025 |
80.67 (-5.11%) |
84.70 |
80.04 - 85.19 |
0.9692 times |
Fri 26 September 2025 |
85.01 (0.44%) |
83.88 |
83.56 - 86.65 |
0.9477 times |
Fri 19 September 2025 |
84.64 (3.9%) |
81.61 |
80.09 - 84.93 |
1.434 times |
Fri 12 September 2025 |
81.46 (3.17%) |
78.99 |
78.56 - 81.64 |
1.3405 times |
Fri 05 September 2025 |
78.96 (-3.92%) |
81.71 |
78.70 - 82.13 |
0.9499 times |
Fri 29 August 2025 |
82.18 (0%) |
81.96 |
81.80 - 82.81 |
0.2043 times |
Fri 29 August 2025 |
82.18 (3.89%) |
78.88 |
78.87 - 83.21 |
1.1627 times |
Fri 22 August 2025 |
79.10 (2.59%) |
76.99 |
76.59 - 79.31 |
0.9207 times |

Monthly price and charts WellsFargo Strong monthly Stock price targets for WellsFargo WFC are 81.82 and 91.67 | Monthly Target 1 | 73.85 | | Monthly Target 2 | 79.94 | | Monthly Target 3 | 83.703333333333 | | Monthly Target 4 | 89.79 | | Monthly Target 5 | 93.55 |
Monthly price and volumes Wells Fargo
| Date |
Closing |
Open |
Range |
Volume |
Mon 20 October 2025 |
86.02 (2.62%) |
83.10 |
77.62 - 87.47 |
0.6417 times |
Tue 30 September 2025 |
83.82 (2%) |
81.71 |
78.56 - 86.65 |
0.897 times |
Fri 29 August 2025 |
82.18 (1.92%) |
79.19 |
76.16 - 83.21 |
0.8548 times |
Thu 31 July 2025 |
80.63 (0.64%) |
80.05 |
77.72 - 84.83 |
1.2621 times |
Mon 30 June 2025 |
80.12 (7.14%) |
74.25 |
71.93 - 81.10 |
1.0278 times |
Fri 30 May 2025 |
74.78 (5.31%) |
70.75 |
70.43 - 76.58 |
0.9246 times |
Wed 30 April 2025 |
71.01 (-1.09%) |
70.84 |
58.42 - 72.48 |
1.4288 times |
Mon 31 March 2025 |
71.79 (-8.34%) |
78.86 |
65.52 - 78.98 |
1.0378 times |
Fri 28 February 2025 |
78.32 (-0.61%) |
77.23 |
74.93 - 81.50 |
0.9038 times |
Fri 31 January 2025 |
78.80 (12.19%) |
70.48 |
69.34 - 79.29 |
1.0216 times |
Tue 31 December 2024 |
70.24 (-9.19%) |
74.05 |
68.61 - 74.55 |
0.7202 times |
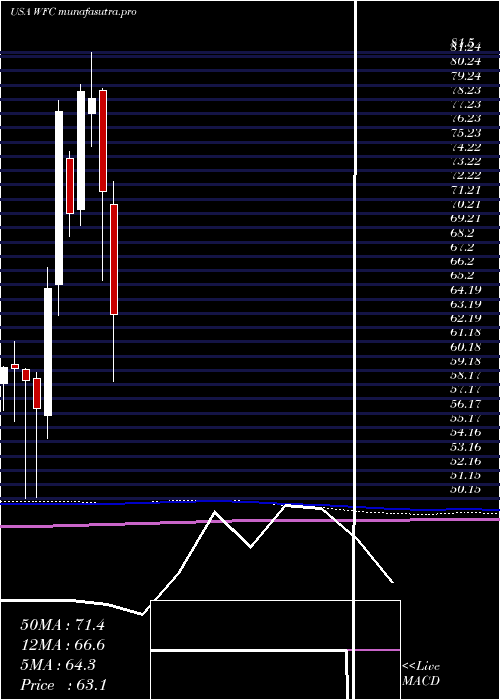
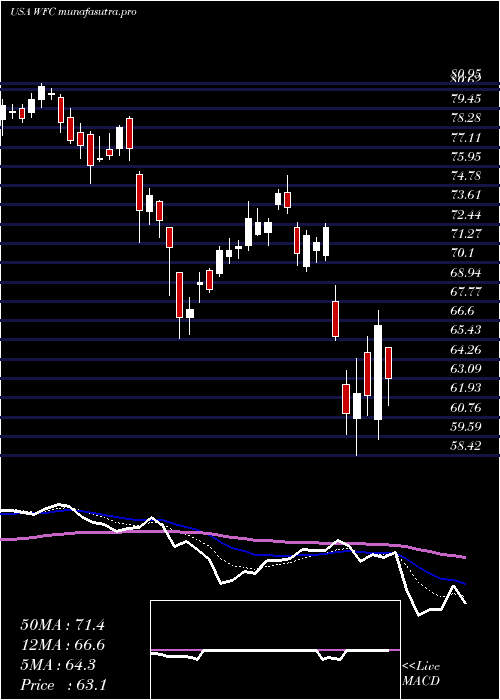
DMA SMA EMA moving averages of Wells Fargo WFC
DMA (daily moving average) of Wells Fargo WFC
| DMA period | DMA value | | 5 day DMA | 84.81 | | 12 day DMA | 81.89 | | 20 day DMA | 82.52 | | 35 day DMA | 82.14 | | 50 day DMA | 81.39 | | 100 day DMA | 80.08 | | 150 day DMA | 76.73 | | 200 day DMA | 76.48 | EMA (exponential moving average) of Wells Fargo WFC
| EMA period | EMA current | EMA prev | EMA prev2 | | 5 day EMA | 84.14 | 83.2 | 83.16 | | 12 day EMA | 82.96 | 82.4 | 82.24 | | 20 day EMA | 82.52 | 82.15 | 82.03 | | 35 day EMA | 81.8 | 81.55 | 81.45 | | 50 day EMA | 81.42 | 81.23 | 81.15 |
SMA (simple moving average) of Wells Fargo WFC
| SMA period | SMA current | SMA prev | SMA prev2 | | 5 day SMA | 84.81 | 83.39 | 82.26 | | 12 day SMA | 81.89 | 81.43 | 81.23 | | 20 day SMA | 82.52 | 82.48 | 82.54 | | 35 day SMA | 82.14 | 82.03 | 82 | | 50 day SMA | 81.39 | 81.22 | 81.11 | | 100 day SMA | 80.08 | 79.96 | 79.86 | | 150 day SMA | 76.73 | 76.63 | 76.53 | | 200 day SMA | 76.48 | 76.4 | 76.34 |
|
|
