WesternMidstream WES full analysis,charts,indicators,moving averages,SMA,DMA,EMA,ADX,MACD,RSIWestern Midstream WES WideScreen charts, DMA,SMA,EMA technical analysis, forecast prediction, by indicators ADX,MACD,RSI,CCI USA stock exchange
operates under Public Utilities sector & deals in Natural Gas Distribution
Daily price and charts and targets WesternMidstream Strong Daily Stock price targets for WesternMidstream WES are 39.78 and 41 | Daily Target 1 | 38.79 | | Daily Target 2 | 39.55 | | Daily Target 3 | 40.013333333333 | | Daily Target 4 | 40.77 | | Daily Target 5 | 41.23 |
Daily price and volume Western Midstream
| Date |
Closing |
Open |
Range |
Volume |
Thu 04 December 2025 |
40.30 (2.73%) |
39.42 |
39.26 - 40.48 |
1.4009 times |
Wed 03 December 2025 |
39.23 (1.13%) |
39.12 |
38.97 - 39.40 |
1.9689 times |
Tue 02 December 2025 |
38.79 (-1.37%) |
39.43 |
38.79 - 39.43 |
0.633 times |
Mon 01 December 2025 |
39.33 (0%) |
39.10 |
39.10 - 39.56 |
1.0523 times |
Fri 28 November 2025 |
39.33 (0.85%) |
39.12 |
39.12 - 39.73 |
0.6599 times |
Wed 26 November 2025 |
39.00 (0%) |
39.07 |
39.00 - 39.46 |
0.9014 times |
Tue 25 November 2025 |
39.00 (0.18%) |
38.93 |
38.77 - 39.31 |
0.9631 times |
Mon 24 November 2025 |
38.93 (-0.08%) |
39.21 |
38.68 - 39.21 |
0.848 times |
Fri 21 November 2025 |
38.96 (0.13%) |
39.00 |
38.60 - 39.05 |
0.6156 times |
Thu 20 November 2025 |
38.91 (-0.23%) |
39.01 |
38.66 - 39.30 |
0.957 times |
Wed 19 November 2025 |
39.00 (-0.08%) |
38.86 |
38.63 - 39.28 |
0.6279 times |
Weekly price and charts WesternMidstream Strong weekly Stock price targets for WesternMidstream WES are 39.55 and 41.24 | Weekly Target 1 | 38.17 | | Weekly Target 2 | 39.23 | | Weekly Target 3 | 39.856666666667 | | Weekly Target 4 | 40.92 | | Weekly Target 5 | 41.55 |
Weekly price and volumes for Western Midstream
| Date |
Closing |
Open |
Range |
Volume |
Thu 04 December 2025 |
40.30 (2.47%) |
39.10 |
38.79 - 40.48 |
0.9697 times |
Fri 28 November 2025 |
39.33 (0.95%) |
39.21 |
38.68 - 39.73 |
0.6469 times |
Fri 21 November 2025 |
38.96 (0.7%) |
38.74 |
38.60 - 39.39 |
0.7722 times |
Fri 14 November 2025 |
38.69 (-0.77%) |
39.21 |
38.44 - 39.74 |
1.3759 times |
Fri 07 November 2025 |
38.99 (4.06%) |
37.21 |
37.01 - 39.45 |
0.8793 times |
Fri 31 October 2025 |
37.47 (0%) |
37.53 |
37.22 - 37.71 |
0.1863 times |
Fri 31 October 2025 |
37.47 (-2.27%) |
38.63 |
37.22 - 38.92 |
0.8613 times |
Fri 24 October 2025 |
38.34 (1.59%) |
37.92 |
37.44 - 39.10 |
1.5246 times |
Fri 17 October 2025 |
37.74 (1.29%) |
37.60 |
37.13 - 38.12 |
1.4507 times |
Fri 10 October 2025 |
37.26 (-5.38%) |
38.53 |
37.24 - 39.40 |
1.333 times |
Fri 03 October 2025 |
39.38 (-0.1%) |
39.65 |
38.25 - 39.97 |
1.284 times |

Monthly price and charts WesternMidstream Strong monthly Stock price targets for WesternMidstream WES are 39.55 and 41.24 | Monthly Target 1 | 38.17 | | Monthly Target 2 | 39.23 | | Monthly Target 3 | 39.856666666667 | | Monthly Target 4 | 40.92 | | Monthly Target 5 | 41.55 |
Monthly price and volumes Western Midstream
| Date |
Closing |
Open |
Range |
Volume |
Thu 04 December 2025 |
40.30 (2.47%) |
39.10 |
38.79 - 40.48 |
0.2941 times |
Fri 28 November 2025 |
39.33 (4.96%) |
37.21 |
37.01 - 39.74 |
1.1144 times |
Fri 31 October 2025 |
37.47 (-4.63%) |
39.26 |
37.13 - 39.97 |
1.8281 times |
Tue 30 September 2025 |
39.29 (0.2%) |
39.19 |
37.78 - 39.95 |
1.0904 times |
Fri 29 August 2025 |
39.21 (-3.73%) |
39.60 |
37.50 - 40.68 |
1.2435 times |
Thu 31 July 2025 |
40.73 (5.25%) |
38.83 |
38.11 - 41.39 |
0.7716 times |
Mon 30 June 2025 |
38.70 (3.48%) |
37.62 |
37.20 - 39.26 |
0.738 times |
Fri 30 May 2025 |
37.40 (-0.53%) |
37.60 |
35.25 - 40.00 |
0.939 times |
Wed 30 April 2025 |
37.60 (-8.2%) |
41.12 |
33.60 - 41.74 |
0.9558 times |
Mon 31 March 2025 |
40.96 (0.94%) |
40.59 |
37.51 - 42.30 |
1.0252 times |
Fri 28 February 2025 |
40.58 (-1.39%) |
39.71 |
39.50 - 41.78 |
0.9653 times |

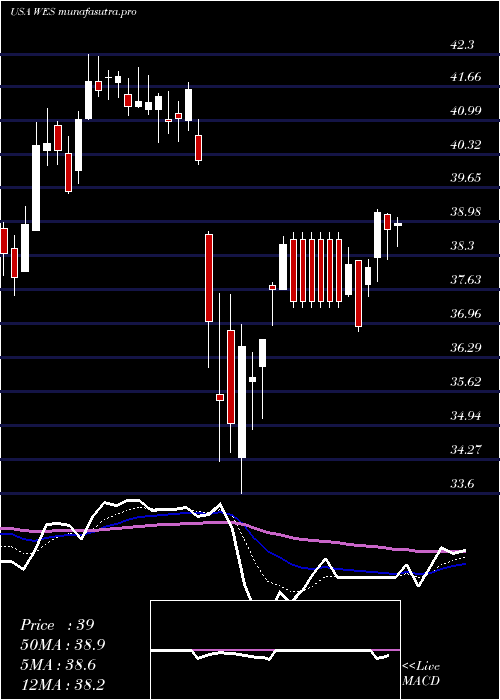
DMA SMA EMA moving averages of Western Midstream WES
DMA (daily moving average) of Western Midstream WES
| DMA period | DMA value | | 5 day DMA | 39.4 | | 12 day DMA | 39.15 | | 20 day DMA | 39.07 | | 35 day DMA | 38.65 | | 50 day DMA | 38.62 | | 100 day DMA | 38.79 | | 150 day DMA | 38.64 | | 200 day DMA | 38.76 | EMA (exponential moving average) of Western Midstream WES
| EMA period | EMA current | EMA prev | EMA prev2 | | 5 day EMA | 39.5 | 39.1 | 39.04 | | 12 day EMA | 39.22 | 39.02 | 38.98 | | 20 day EMA | 39.03 | 38.9 | 38.87 | | 35 day EMA | 38.89 | 38.81 | 38.78 | | 50 day EMA | 38.7 | 38.63 | 38.61 |
SMA (simple moving average) of Western Midstream WES
| SMA period | SMA current | SMA prev | SMA prev2 | | 5 day SMA | 39.4 | 39.14 | 39.09 | | 12 day SMA | 39.15 | 39.04 | 39 | | 20 day SMA | 39.07 | 38.96 | 38.87 | | 35 day SMA | 38.65 | 38.58 | 38.52 | | 50 day SMA | 38.62 | 38.6 | 38.58 | | 100 day SMA | 38.79 | 38.79 | 38.79 | | 150 day SMA | 38.64 | 38.62 | 38.61 | | 200 day SMA | 38.76 | 38.77 | 38.78 |
|
|
