WecEnergy WEC full analysis,charts,indicators,moving averages,SMA,DMA,EMA,ADX,MACD,RSIWec Energy WEC WideScreen charts, DMA,SMA,EMA technical analysis, forecast prediction, by indicators ADX,MACD,RSI,CCI USA stock exchange
operates under Public Utilities sector & deals in Power Generation
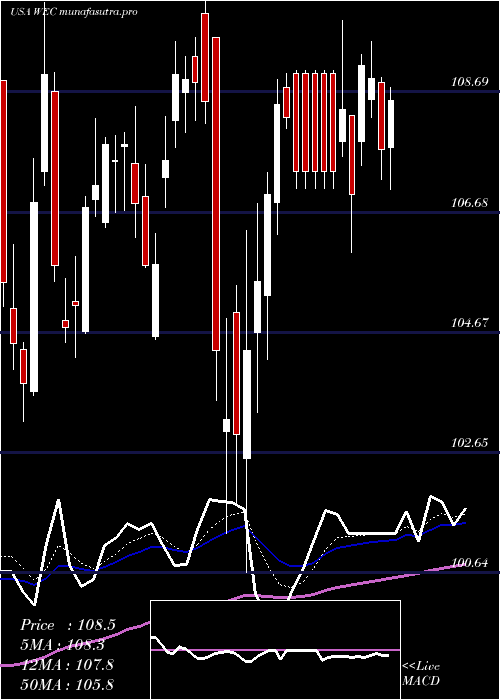
Daily price and charts and targets WecEnergy Strong Daily Stock price targets for WecEnergy WEC are 117.04 and 117.97 | Daily Target 1 | 116.48 | | Daily Target 2 | 116.99 | | Daily Target 3 | 117.41 | | Daily Target 4 | 117.92 | | Daily Target 5 | 118.34 |
Daily price and volume Wec Energy
| Date |
Closing |
Open |
Range |
Volume |
Mon 20 October 2025 |
117.50 (0.56%) |
117.50 |
116.90 - 117.83 |
1.1138 times |
Fri 17 October 2025 |
116.84 (0.56%) |
116.42 |
115.97 - 117.18 |
1.0668 times |
Thu 16 October 2025 |
116.19 (-0.93%) |
117.24 |
116.04 - 118.10 |
1.4558 times |
Wed 15 October 2025 |
117.28 (0.68%) |
116.48 |
116.47 - 117.48 |
1.0495 times |
Tue 14 October 2025 |
116.49 (1.32%) |
115.64 |
115.18 - 117.20 |
1.1196 times |
Mon 13 October 2025 |
114.97 (-0.14%) |
114.50 |
114.50 - 115.70 |
0.7468 times |
Fri 10 October 2025 |
115.13 (1.1%) |
114.29 |
113.87 - 115.63 |
0.8298 times |
Thu 09 October 2025 |
113.88 (-0.62%) |
115.24 |
113.84 - 115.63 |
0.8272 times |
Wed 08 October 2025 |
114.59 (-0.53%) |
115.65 |
114.17 - 115.65 |
0.8185 times |
Tue 07 October 2025 |
115.20 (0.57%) |
114.75 |
114.54 - 115.90 |
0.9722 times |
Mon 06 October 2025 |
114.55 (1.11%) |
113.73 |
113.41 - 114.63 |
0.4942 times |
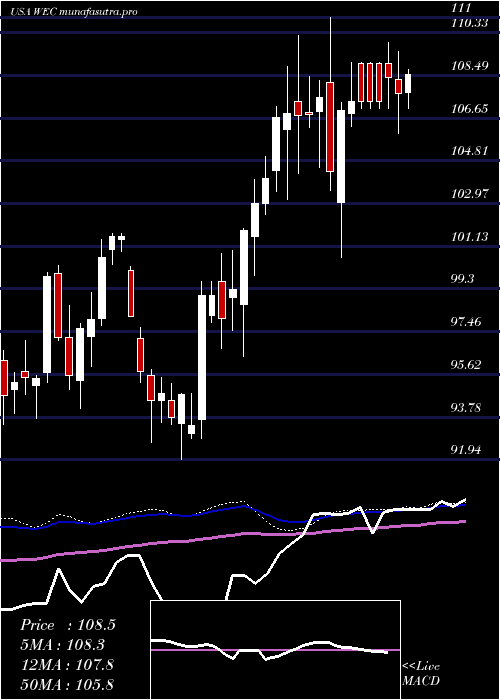
Weekly price and charts WecEnergy Strong weekly Stock price targets for WecEnergy WEC are 117.04 and 117.97 | Weekly Target 1 | 116.48 | | Weekly Target 2 | 116.99 | | Weekly Target 3 | 117.41 | | Weekly Target 4 | 117.92 | | Weekly Target 5 | 118.34 |
Weekly price and volumes for Wec Energy
| Date |
Closing |
Open |
Range |
Volume |
Mon 20 October 2025 |
117.50 (0.56%) |
117.50 |
116.90 - 117.83 |
0.2446 times |
Fri 17 October 2025 |
116.84 (1.49%) |
114.50 |
114.50 - 118.10 |
1.1944 times |
Fri 10 October 2025 |
115.13 (1.62%) |
113.73 |
113.41 - 115.90 |
0.8657 times |
Fri 03 October 2025 |
113.29 (0.39%) |
112.87 |
111.57 - 114.97 |
1.3132 times |
Fri 26 September 2025 |
112.85 (2.48%) |
110.18 |
109.36 - 112.92 |
1.3045 times |
Fri 19 September 2025 |
110.12 (-0.36%) |
110.51 |
108.15 - 111.26 |
1.3719 times |
Fri 12 September 2025 |
110.52 (2.53%) |
107.52 |
106.65 - 110.78 |
1.3486 times |
Fri 05 September 2025 |
107.79 (1.2%) |
106.23 |
105.50 - 108.22 |
1.0563 times |
Fri 29 August 2025 |
106.51 (0%) |
106.51 |
106.25 - 107.24 |
0.1914 times |
Fri 29 August 2025 |
106.51 (-1.87%) |
108.22 |
106.18 - 108.39 |
1.1094 times |
Fri 22 August 2025 |
108.54 (1.1%) |
107.55 |
106.39 - 110.27 |
1.2634 times |
Monthly price and charts WecEnergy Strong monthly Stock price targets for WecEnergy WEC are 114.54 and 121.07 | Monthly Target 1 | 109.19 | | Monthly Target 2 | 113.35 | | Monthly Target 3 | 115.72333333333 | | Monthly Target 4 | 119.88 | | Monthly Target 5 | 122.25 |
Monthly price and volumes Wec Energy
| Date |
Closing |
Open |
Range |
Volume |
Mon 20 October 2025 |
117.50 (2.54%) |
114.38 |
111.57 - 118.10 |
0.5737 times |
Tue 30 September 2025 |
114.59 (7.59%) |
106.23 |
105.50 - 114.97 |
1.0602 times |
Fri 29 August 2025 |
106.51 (-2.36%) |
109.95 |
106.18 - 111.90 |
1.0324 times |
Thu 31 July 2025 |
109.08 (4.68%) |
104.53 |
102.49 - 110.35 |
0.956 times |
Mon 30 June 2025 |
104.20 (-3.02%) |
106.69 |
102.55 - 107.67 |
0.976 times |
Fri 30 May 2025 |
107.44 (-1.9%) |
109.08 |
100.61 - 110.65 |
1.0649 times |
Wed 30 April 2025 |
109.52 (0.5%) |
108.68 |
100.64 - 111.00 |
1.0571 times |
Mon 31 March 2025 |
108.98 (2.15%) |
106.16 |
103.17 - 110.19 |
1.19 times |
Fri 28 February 2025 |
106.69 (7.49%) |
98.61 |
96.37 - 107.14 |
1.0208 times |
Fri 31 January 2025 |
99.26 (5.55%) |
95.20 |
91.94 - 100.98 |
1.069 times |
Tue 31 December 2024 |
94.04 (-7.4%) |
100.11 |
92.70 - 100.27 |
0.5492 times |

DMA SMA EMA moving averages of Wec Energy WEC
DMA (daily moving average) of Wec Energy WEC
| DMA period | DMA value | | 5 day DMA | 116.86 | | 12 day DMA | 115.49 | | 20 day DMA | 114.38 | | 35 day DMA | 111.96 | | 50 day DMA | 110.71 | | 100 day DMA | 108.57 | | 150 day DMA | 108.1 | | 200 day DMA | 106.4 | EMA (exponential moving average) of Wec Energy WEC
| EMA period | EMA current | EMA prev | EMA prev2 | | 5 day EMA | 116.69 | 116.29 | 116.01 | | 12 day EMA | 115.55 | 115.2 | 114.9 | | 20 day EMA | 114.43 | 114.11 | 113.82 | | 35 day EMA | 112.87 | 112.6 | 112.35 | | 50 day EMA | 111.26 | 111.01 | 110.77 |
SMA (simple moving average) of Wec Energy WEC
| SMA period | SMA current | SMA prev | SMA prev2 | | 5 day SMA | 116.86 | 116.35 | 116.01 | | 12 day SMA | 115.49 | 115.04 | 114.72 | | 20 day SMA | 114.38 | 114 | 113.66 | | 35 day SMA | 111.96 | 111.65 | 111.35 | | 50 day SMA | 110.71 | 110.55 | 110.42 | | 100 day SMA | 108.57 | 108.47 | 108.37 | | 150 day SMA | 108.1 | 108.03 | 107.96 | | 200 day SMA | 106.4 | 106.28 | 106.17 |
|
|
