Wd40 WDFC full analysis,charts,indicators,moving averages,SMA,DMA,EMA,ADX,MACD,RSIWd 40 WDFC WideScreen charts, DMA,SMA,EMA technical analysis, forecast prediction, by indicators ADX,MACD,RSI,CCI USA stock exchange
operates under Basic Industries sector & deals in Major Chemicals
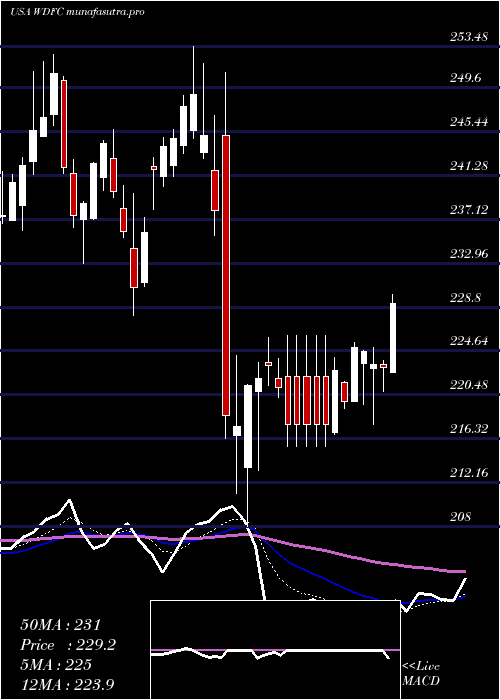
Daily price and charts and targets Wd40 Strong Daily Stock price targets for Wd40 WDFC are 192.1 and 195.09 | Daily Target 1 | 189.78 | | Daily Target 2 | 191.43 | | Daily Target 3 | 192.77333333333 | | Daily Target 4 | 194.42 | | Daily Target 5 | 195.76 |
Daily price and volume Wd 40
| Date |
Closing |
Open |
Range |
Volume |
Mon 20 October 2025 |
193.07 (-0.73%) |
193.05 |
191.13 - 194.12 |
1.1861 times |
Fri 17 October 2025 |
194.48 (2.64%) |
190.56 |
190.56 - 194.82 |
1.0825 times |
Thu 16 October 2025 |
189.47 (-0.5%) |
190.30 |
188.44 - 192.87 |
1.0746 times |
Wed 15 October 2025 |
190.43 (-0.41%) |
190.64 |
189.04 - 194.85 |
1.3524 times |
Tue 14 October 2025 |
191.22 (-0.73%) |
192.40 |
190.50 - 195.40 |
0.971 times |
Mon 13 October 2025 |
192.62 (0.25%) |
192.35 |
190.05 - 193.61 |
0.8064 times |
Fri 10 October 2025 |
192.14 (-0.3%) |
192.92 |
190.01 - 193.93 |
0.9449 times |
Thu 09 October 2025 |
192.72 (0.16%) |
192.60 |
191.44 - 193.00 |
0.7211 times |
Wed 08 October 2025 |
192.41 (-0.81%) |
193.98 |
191.71 - 194.99 |
0.7899 times |
Tue 07 October 2025 |
193.98 (1.26%) |
192.52 |
190.67 - 194.12 |
1.0711 times |
Mon 06 October 2025 |
191.56 (-1.36%) |
194.02 |
191.00 - 194.45 |
1.0154 times |
Weekly price and charts Wd40 Strong weekly Stock price targets for Wd40 WDFC are 192.1 and 195.09 | Weekly Target 1 | 189.78 | | Weekly Target 2 | 191.43 | | Weekly Target 3 | 192.77333333333 | | Weekly Target 4 | 194.42 | | Weekly Target 5 | 195.76 |
Weekly price and volumes for Wd 40
| Date |
Closing |
Open |
Range |
Volume |
Mon 20 October 2025 |
193.07 (-0.73%) |
193.05 |
191.13 - 194.12 |
0.2595 times |
Fri 17 October 2025 |
194.48 (1.22%) |
192.35 |
188.44 - 195.40 |
1.1565 times |
Fri 10 October 2025 |
192.14 (-1.06%) |
194.02 |
190.01 - 194.99 |
0.9936 times |
Fri 03 October 2025 |
194.20 (-2.43%) |
198.98 |
191.38 - 199.54 |
1.1524 times |
Fri 26 September 2025 |
199.04 (-5.38%) |
209.62 |
196.78 - 211.90 |
1.3754 times |
Fri 19 September 2025 |
210.36 (-0.32%) |
211.44 |
206.22 - 216.74 |
2.1719 times |
Fri 12 September 2025 |
211.03 (-3.23%) |
217.96 |
209.13 - 221.25 |
1.0961 times |
Fri 05 September 2025 |
218.08 (0.94%) |
215.33 |
211.88 - 219.57 |
0.7427 times |
Fri 29 August 2025 |
216.04 (0%) |
218.75 |
215.68 - 219.92 |
0.1722 times |
Fri 29 August 2025 |
216.04 (-2.93%) |
221.81 |
215.69 - 222.00 |
0.8797 times |
Fri 22 August 2025 |
222.57 (1.18%) |
220.63 |
215.00 - 224.00 |
0.7187 times |
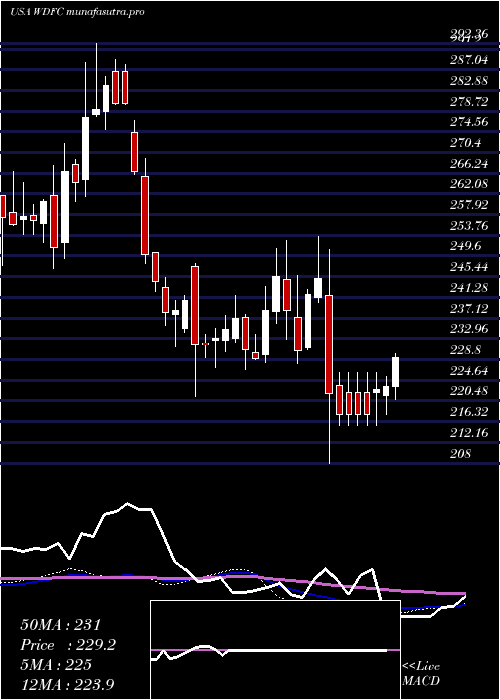
Monthly price and charts Wd40 Strong monthly Stock price targets for Wd40 WDFC are 186.13 and 195.39 | Monthly Target 1 | 183.81 | | Monthly Target 2 | 188.44 | | Monthly Target 3 | 193.07 | | Monthly Target 4 | 197.7 | | Monthly Target 5 | 202.33 |
Monthly price and volumes Wd 40
| Date |
Closing |
Open |
Range |
Volume |
Mon 20 October 2025 |
193.07 (-2.29%) |
196.55 |
188.44 - 197.70 |
0.5592 times |
Tue 30 September 2025 |
197.60 (-8.54%) |
215.33 |
194.53 - 221.25 |
1.1299 times |
Fri 29 August 2025 |
216.04 (0.76%) |
214.40 |
212.12 - 226.23 |
0.7088 times |
Thu 31 July 2025 |
214.40 (-6%) |
228.09 |
209.50 - 237.33 |
1.5445 times |
Mon 30 June 2025 |
228.09 (-6.38%) |
242.23 |
224.19 - 247.33 |
1.985 times |
Fri 30 May 2025 |
243.63 (6.69%) |
228.01 |
224.77 - 248.64 |
0.6641 times |
Wed 30 April 2025 |
228.36 (-6.41%) |
242.21 |
208.00 - 253.48 |
1.0941 times |
Mon 31 March 2025 |
244.00 (2.25%) |
238.43 |
227.97 - 252.74 |
0.8338 times |
Fri 28 February 2025 |
238.62 (1.56%) |
233.09 |
226.73 - 243.52 |
0.5985 times |
Fri 31 January 2025 |
234.95 (-3.19%) |
243.16 |
221.34 - 248.00 |
0.882 times |
Tue 31 December 2024 |
242.68 (-13.41%) |
274.38 |
240.02 - 276.80 |
0.5285 times |

DMA SMA EMA moving averages of Wd 40 WDFC
DMA (daily moving average) of Wd 40 WDFC
| DMA period | DMA value | | 5 day DMA | 191.73 | | 12 day DMA | 192.36 | | 20 day DMA | 194.94 | | 35 day DMA | 202.47 | | 50 day DMA | 207.7 | | 100 day DMA | 218.34 | | 150 day DMA | 223.16 | | 200 day DMA | 226.29 | EMA (exponential moving average) of Wd 40 WDFC
| EMA period | EMA current | EMA prev | EMA prev2 | | 5 day EMA | 192.44 | 192.13 | 190.95 | | 12 day EMA | 193.48 | 193.55 | 193.38 | | 20 day EMA | 196.1 | 196.42 | 196.62 | | 35 day EMA | 201.17 | 201.65 | 202.07 | | 50 day EMA | 207.05 | 207.62 | 208.16 |
SMA (simple moving average) of Wd 40 WDFC
| SMA period | SMA current | SMA prev | SMA prev2 | | 5 day SMA | 191.73 | 191.64 | 191.18 | | 12 day SMA | 192.36 | 192.59 | 192.67 | | 20 day SMA | 194.94 | 195.68 | 196.47 | | 35 day SMA | 202.47 | 203.12 | 203.74 | | 50 day SMA | 207.7 | 208.2 | 208.7 | | 100 day SMA | 218.34 | 218.85 | 219.32 | | 150 day SMA | 223.16 | 223.46 | 223.75 | | 200 day SMA | 226.29 | 226.52 | 226.77 |
|
|
