WorkdayInc WDAY full analysis,charts,indicators,moving averages,SMA,DMA,EMA,ADX,MACD,RSIWorkday Inc WDAY WideScreen charts, DMA,SMA,EMA technical analysis, forecast prediction, by indicators ADX,MACD,RSI,CCI USA stock exchange
operates under Technology sector & deals in EDP Services
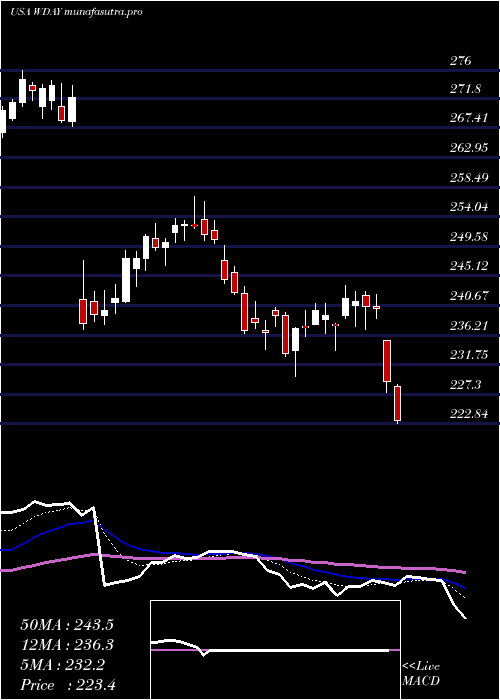
Daily price and charts and targets WorkdayInc Strong Daily Stock price targets for WorkdayInc WDAY are 237.17 and 246.26 | Daily Target 1 | 229.76 | | Daily Target 2 | 235.48 | | Daily Target 3 | 238.85 | | Daily Target 4 | 244.57 | | Daily Target 5 | 247.94 |
Daily price and volume Workday Inc
| Date |
Closing |
Open |
Range |
Volume |
Mon 20 October 2025 |
241.20 (2.97%) |
235.56 |
233.13 - 242.22 |
1.019 times |
Fri 17 October 2025 |
234.25 (2.92%) |
229.09 |
229.07 - 235.05 |
1.0281 times |
Thu 16 October 2025 |
227.60 (-3.05%) |
236.79 |
227.14 - 241.00 |
1.0974 times |
Wed 15 October 2025 |
234.76 (-1.02%) |
237.22 |
234.09 - 238.18 |
0.876 times |
Tue 14 October 2025 |
237.18 (0.25%) |
233.71 |
232.80 - 238.97 |
0.8779 times |
Mon 13 October 2025 |
236.60 (1.47%) |
234.46 |
232.50 - 237.29 |
0.673 times |
Fri 10 October 2025 |
233.18 (-2.12%) |
238.14 |
232.78 - 240.16 |
1.111 times |
Thu 09 October 2025 |
238.22 (-0.01%) |
237.84 |
237.19 - 241.26 |
1.4046 times |
Wed 08 October 2025 |
238.25 (2.18%) |
233.90 |
232.42 - 238.38 |
0.9458 times |
Tue 07 October 2025 |
233.17 (-2.18%) |
238.91 |
229.75 - 238.91 |
0.9673 times |
Mon 06 October 2025 |
238.36 (0.79%) |
235.66 |
234.69 - 243.95 |
1.1032 times |
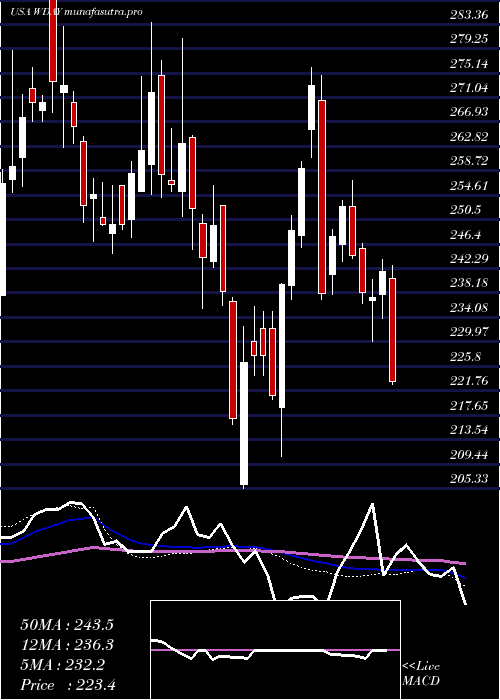
Weekly price and charts WorkdayInc Strong weekly Stock price targets for WorkdayInc WDAY are 237.17 and 246.26 | Weekly Target 1 | 229.76 | | Weekly Target 2 | 235.48 | | Weekly Target 3 | 238.85 | | Weekly Target 4 | 244.57 | | Weekly Target 5 | 247.94 |
Weekly price and volumes for Workday Inc
| Date |
Closing |
Open |
Range |
Volume |
Mon 20 October 2025 |
241.20 (2.97%) |
235.56 |
233.13 - 242.22 |
0.1586 times |
Fri 17 October 2025 |
234.25 (0.46%) |
234.46 |
227.14 - 241.00 |
0.7083 times |
Fri 10 October 2025 |
233.18 (-1.4%) |
235.66 |
229.75 - 243.95 |
0.8608 times |
Fri 03 October 2025 |
236.48 (-4.13%) |
247.62 |
230.81 - 249.85 |
1.1798 times |
Fri 26 September 2025 |
246.67 (5.59%) |
232.02 |
230.73 - 249.05 |
1.2835 times |
Fri 19 September 2025 |
233.62 (4.58%) |
222.71 |
218.00 - 240.63 |
2.0929 times |
Fri 12 September 2025 |
223.39 (-3.33%) |
231.62 |
222.11 - 233.57 |
0.971 times |
Fri 05 September 2025 |
231.08 (0.11%) |
227.49 |
226.35 - 237.50 |
1.0072 times |
Fri 29 August 2025 |
230.82 (0%) |
227.69 |
227.69 - 230.86 |
0.2471 times |
Fri 29 August 2025 |
230.82 (4.32%) |
222.48 |
220.60 - 232.45 |
1.4908 times |
Fri 22 August 2025 |
221.27 (-2.13%) |
227.22 |
211.31 - 234.92 |
1.9814 times |
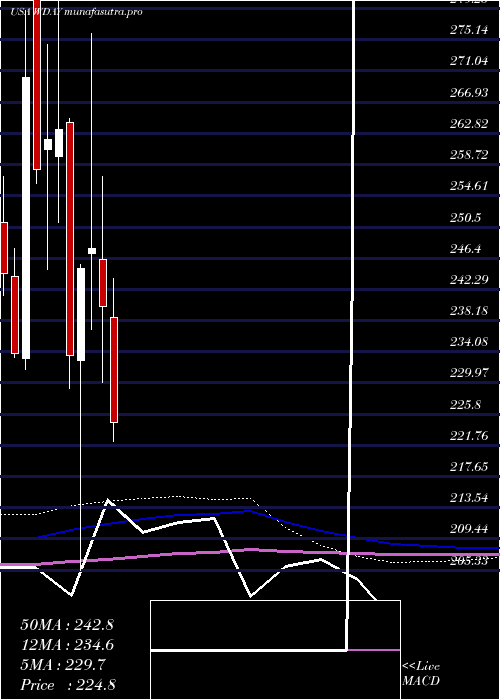
Monthly price and charts WorkdayInc Strong monthly Stock price targets for WorkdayInc WDAY are 234.17 and 250.98 | Monthly Target 1 | 220.62 | | Monthly Target 2 | 230.91 | | Monthly Target 3 | 237.43 | | Monthly Target 4 | 247.72 | | Monthly Target 5 | 254.24 |
Monthly price and volumes Workday Inc
| Date |
Closing |
Open |
Range |
Volume |
Mon 20 October 2025 |
241.20 (0.2%) |
239.35 |
227.14 - 243.95 |
0.608 times |
Tue 30 September 2025 |
240.73 (4.29%) |
227.49 |
218.00 - 249.85 |
1.4957 times |
Fri 29 August 2025 |
230.82 (0.63%) |
228.74 |
206.77 - 234.92 |
1.6308 times |
Thu 31 July 2025 |
229.38 (-4.43%) |
238.59 |
222.26 - 243.73 |
0.9677 times |
Mon 30 June 2025 |
240.00 (-3.11%) |
246.26 |
230.06 - 257.09 |
0.7365 times |
Fri 30 May 2025 |
247.71 (1.11%) |
247.05 |
237.00 - 276.00 |
0.9725 times |
Wed 30 April 2025 |
245.00 (4.91%) |
232.95 |
205.33 - 245.52 |
0.9931 times |
Mon 31 March 2025 |
233.53 (-11.32%) |
264.26 |
229.29 - 264.72 |
0.7415 times |
Fri 28 February 2025 |
263.34 (0.49%) |
259.73 |
251.03 - 283.68 |
1.0118 times |
Fri 31 January 2025 |
262.06 (1.56%) |
260.68 |
244.88 - 274.50 |
0.8425 times |
Tue 31 December 2024 |
258.03 (-4.5%) |
291.60 |
256.19 - 294.00 |
1.8551 times |
DMA SMA EMA moving averages of Workday Inc WDAY
DMA (daily moving average) of Workday Inc WDAY
| DMA period | DMA value | | 5 day DMA | 235 | | 12 day DMA | 235.77 | | 20 day DMA | 237.67 | | 35 day DMA | 234.39 | | 50 day DMA | 231.87 | | 100 day DMA | 234.71 | | 150 day DMA | 237.62 | | 200 day DMA | 242.56 | EMA (exponential moving average) of Workday Inc WDAY
| EMA period | EMA current | EMA prev | EMA prev2 | | 5 day EMA | 236.07 | 233.5 | 233.13 | | 12 day EMA | 235.84 | 234.86 | 234.97 | | 20 day EMA | 235.5 | 234.9 | 234.97 | | 35 day EMA | 233.78 | 233.34 | 233.29 | | 50 day EMA | 231.39 | 230.99 | 230.86 |
SMA (simple moving average) of Workday Inc WDAY
| SMA period | SMA current | SMA prev | SMA prev2 | | 5 day SMA | 235 | 234.08 | 233.86 | | 12 day SMA | 235.77 | 235.03 | 234.86 | | 20 day SMA | 237.67 | 237.75 | 237.71 | | 35 day SMA | 234.39 | 234.09 | 233.99 | | 50 day SMA | 231.87 | 231.32 | 231.07 | | 100 day SMA | 234.71 | 234.69 | 234.73 | | 150 day SMA | 237.62 | 237.62 | 237.68 | | 200 day SMA | 242.56 | 242.66 | 242.82 |
|
|
