WebsterFinancial WBS full analysis,charts,indicators,moving averages,SMA,DMA,EMA,ADX,MACD,RSIWebster Financial WBS WideScreen charts, DMA,SMA,EMA technical analysis, forecast prediction, by indicators ADX,MACD,RSI,CCI USA stock exchange
operates under Finance sector & deals in Major Banks
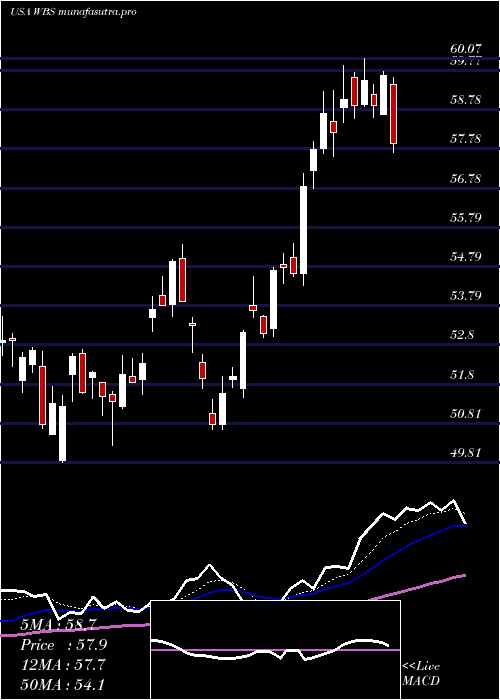
Daily price and charts and targets WebsterFinancial Strong Daily Stock price targets for WebsterFinancial WBS are 61.91 and 62.99 | Daily Target 1 | 61.14 | | Daily Target 2 | 61.59 | | Daily Target 3 | 62.216666666667 | | Daily Target 4 | 62.67 | | Daily Target 5 | 63.3 |
Daily price and volume Webster Financial
| Date |
Closing |
Open |
Range |
Volume |
Thu 04 December 2025 |
62.05 (-0.06%) |
62.00 |
61.76 - 62.84 |
1.2022 times |
Wed 03 December 2025 |
62.09 (2.8%) |
60.34 |
60.19 - 62.30 |
1.6365 times |
Tue 02 December 2025 |
60.40 (-0.17%) |
60.88 |
60.32 - 61.16 |
0.8162 times |
Mon 01 December 2025 |
60.50 (1.51%) |
59.45 |
59.45 - 60.80 |
0.9446 times |
Fri 28 November 2025 |
59.60 (0.3%) |
59.58 |
59.00 - 59.86 |
0.4402 times |
Wed 26 November 2025 |
59.42 (-0.74%) |
59.70 |
59.37 - 60.11 |
0.6267 times |
Tue 25 November 2025 |
59.86 (3.31%) |
58.20 |
58.08 - 60.41 |
0.9609 times |
Mon 24 November 2025 |
57.94 (0.52%) |
57.54 |
57.20 - 58.28 |
0.7922 times |
Fri 21 November 2025 |
57.64 (3.3%) |
55.98 |
55.97 - 58.37 |
1.0396 times |
Thu 20 November 2025 |
55.80 (-0.91%) |
57.13 |
55.75 - 58.04 |
1.5409 times |
Wed 19 November 2025 |
56.31 (1.75%) |
55.41 |
54.98 - 56.51 |
1.3897 times |
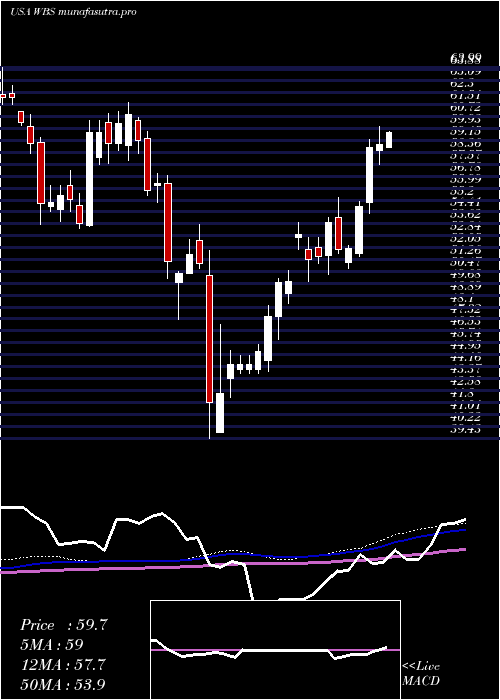
Weekly price and charts WebsterFinancial Strong weekly Stock price targets for WebsterFinancial WBS are 60.75 and 64.14 | Weekly Target 1 | 58.06 | | Weekly Target 2 | 60.05 | | Weekly Target 3 | 61.446666666667 | | Weekly Target 4 | 63.44 | | Weekly Target 5 | 64.84 |
Weekly price and volumes for Webster Financial
| Date |
Closing |
Open |
Range |
Volume |
Thu 04 December 2025 |
62.05 (4.11%) |
59.45 |
59.45 - 62.84 |
0.8119 times |
Fri 28 November 2025 |
59.60 (3.4%) |
57.54 |
57.20 - 60.41 |
0.4978 times |
Fri 21 November 2025 |
57.64 (2.14%) |
56.20 |
53.64 - 58.37 |
1.1173 times |
Fri 14 November 2025 |
56.43 (-1.96%) |
57.43 |
55.70 - 58.60 |
0.7637 times |
Fri 07 November 2025 |
57.56 (0.91%) |
56.29 |
55.63 - 58.00 |
0.7767 times |
Fri 31 October 2025 |
57.04 (0%) |
56.22 |
55.80 - 57.13 |
0.2273 times |
Fri 31 October 2025 |
57.04 (0.99%) |
57.13 |
55.78 - 57.70 |
1.237 times |
Fri 24 October 2025 |
56.48 (4.07%) |
54.60 |
54.26 - 57.02 |
1.6159 times |
Fri 17 October 2025 |
54.27 (-2.65%) |
56.88 |
52.69 - 59.98 |
1.966 times |
Fri 10 October 2025 |
55.75 (-6.48%) |
60.50 |
55.62 - 62.16 |
0.9863 times |
Fri 03 October 2025 |
59.61 (-0.38%) |
59.95 |
58.24 - 60.06 |
0.9957 times |
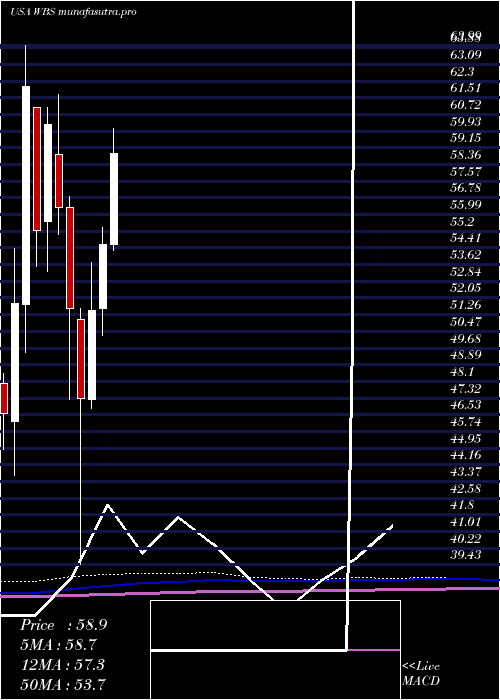
Monthly price and charts WebsterFinancial Strong monthly Stock price targets for WebsterFinancial WBS are 60.75 and 64.14 | Monthly Target 1 | 58.06 | | Monthly Target 2 | 60.05 | | Monthly Target 3 | 61.446666666667 | | Monthly Target 4 | 63.44 | | Monthly Target 5 | 64.84 |
Monthly price and volumes Webster Financial
| Date |
Closing |
Open |
Range |
Volume |
Thu 04 December 2025 |
62.05 (4.11%) |
59.45 |
59.45 - 62.84 |
0.1844 times |
Fri 28 November 2025 |
59.60 (4.49%) |
56.29 |
53.64 - 60.41 |
0.7167 times |
Fri 31 October 2025 |
57.04 (-4.04%) |
58.84 |
52.69 - 62.16 |
1.4952 times |
Tue 30 September 2025 |
59.44 (-4.47%) |
61.21 |
58.34 - 63.59 |
1.1274 times |
Fri 29 August 2025 |
62.22 (7.93%) |
56.43 |
55.03 - 63.25 |
0.8919 times |
Thu 31 July 2025 |
57.65 (5.59%) |
54.60 |
54.31 - 62.00 |
1.2845 times |
Mon 30 June 2025 |
54.60 (6.06%) |
51.53 |
50.25 - 55.38 |
1.0133 times |
Fri 30 May 2025 |
51.48 (8.84%) |
47.25 |
46.81 - 53.70 |
0.8672 times |
Wed 30 April 2025 |
47.30 (-8.24%) |
51.03 |
39.43 - 51.57 |
1.2703 times |
Mon 31 March 2025 |
51.55 (-8.47%) |
56.32 |
47.27 - 56.85 |
1.1492 times |
Fri 28 February 2025 |
56.32 (-6.51%) |
58.81 |
55.04 - 61.65 |
0.5832 times |
DMA SMA EMA moving averages of Webster Financial WBS
DMA (daily moving average) of Webster Financial WBS
| DMA period | DMA value | | 5 day DMA | 60.93 | | 12 day DMA | 58.91 | | 20 day DMA | 58.04 | | 35 day DMA | 57.22 | | 50 day DMA | 57.78 | | 100 day DMA | 58.84 | | 150 day DMA | 57.01 | | 200 day DMA | 55.09 | EMA (exponential moving average) of Webster Financial WBS
| EMA period | EMA current | EMA prev | EMA prev2 | | 5 day EMA | 61.02 | 60.51 | 59.72 | | 12 day EMA | 59.58 | 59.13 | 58.59 | | 20 day EMA | 58.78 | 58.44 | 58.06 | | 35 day EMA | 58.45 | 58.24 | 58.01 | | 50 day EMA | 58.38 | 58.23 | 58.07 |
SMA (simple moving average) of Webster Financial WBS
| SMA period | SMA current | SMA prev | SMA prev2 | | 5 day SMA | 60.93 | 60.4 | 59.96 | | 12 day SMA | 58.91 | 58.28 | 57.81 | | 20 day SMA | 58.04 | 57.8 | 57.53 | | 35 day SMA | 57.22 | 57.11 | 57.04 | | 50 day SMA | 57.78 | 57.75 | 57.72 | | 100 day SMA | 58.84 | 58.8 | 58.77 | | 150 day SMA | 57.01 | 56.92 | 56.82 | | 200 day SMA | 55.09 | 55.07 | 55.06 |
|
|
