WashingtonTrust WASH full analysis,charts,indicators,moving averages,SMA,DMA,EMA,ADX,MACD,RSIWashington Trust WASH WideScreen charts, DMA,SMA,EMA technical analysis, forecast prediction, by indicators ADX,MACD,RSI,CCI USA stock exchange
operates under Finance sector & deals in Major Banks
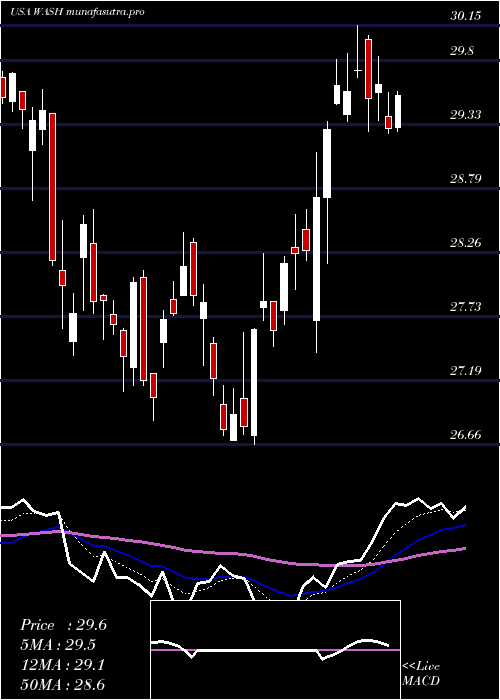
Daily price and charts and targets WashingtonTrust Strong Daily Stock price targets for WashingtonTrust WASH are 27.28 and 28.57 | Daily Target 1 | 26.32 | | Daily Target 2 | 26.94 | | Daily Target 3 | 27.613333333333 | | Daily Target 4 | 28.23 | | Daily Target 5 | 28.9 |
Daily price and volume Washington Trust
| Date |
Closing |
Open |
Range |
Volume |
Tue 21 October 2025 |
27.55 (2.65%) |
27.00 |
27.00 - 28.29 |
1.0245 times |
Mon 20 October 2025 |
26.84 (3.83%) |
26.00 |
25.95 - 26.89 |
0.7596 times |
Fri 17 October 2025 |
25.85 (1.57%) |
25.70 |
25.59 - 26.03 |
0.9068 times |
Thu 16 October 2025 |
25.45 (-5.36%) |
26.76 |
25.23 - 26.76 |
1.1729 times |
Wed 15 October 2025 |
26.89 (-0.7%) |
27.22 |
26.80 - 27.46 |
0.592 times |
Tue 14 October 2025 |
27.08 (1.96%) |
26.47 |
26.47 - 27.23 |
0.8201 times |
Mon 13 October 2025 |
26.56 (0.64%) |
26.86 |
26.25 - 26.86 |
0.9779 times |
Fri 10 October 2025 |
26.39 (-1.53%) |
26.80 |
26.17 - 27.02 |
1.8581 times |
Thu 09 October 2025 |
26.80 (-5.5%) |
27.89 |
26.45 - 27.89 |
1.3839 times |
Wed 08 October 2025 |
28.36 (-1.8%) |
29.25 |
28.34 - 29.25 |
0.5041 times |
Tue 07 October 2025 |
28.88 (-1.74%) |
29.40 |
28.85 - 29.70 |
0.6525 times |
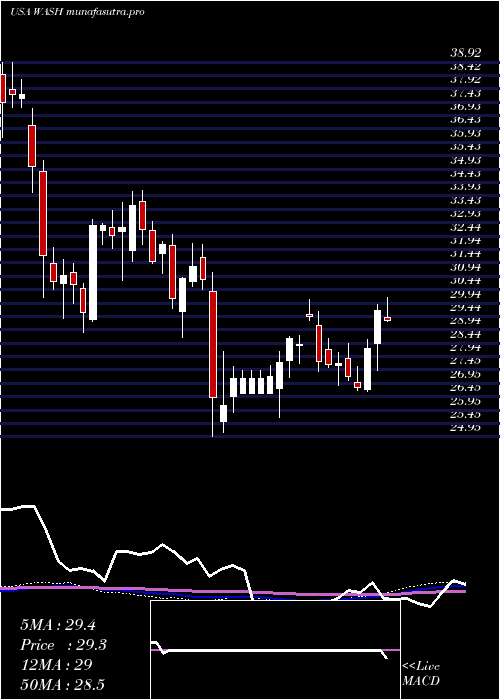
Weekly price and charts WashingtonTrust Strong weekly Stock price targets for WashingtonTrust WASH are 26.75 and 29.09 | Weekly Target 1 | 24.92 | | Weekly Target 2 | 26.24 | | Weekly Target 3 | 27.263333333333 | | Weekly Target 4 | 28.58 | | Weekly Target 5 | 29.6 |
Weekly price and volumes for Washington Trust
| Date |
Closing |
Open |
Range |
Volume |
Tue 21 October 2025 |
27.55 (6.58%) |
26.00 |
25.95 - 28.29 |
0.6945 times |
Fri 17 October 2025 |
25.85 (-2.05%) |
26.86 |
25.23 - 27.46 |
1.7398 times |
Fri 10 October 2025 |
26.39 (-8.65%) |
29.11 |
26.17 - 29.70 |
1.965 times |
Fri 03 October 2025 |
28.89 (-1.26%) |
29.51 |
27.89 - 29.54 |
1.0834 times |
Fri 26 September 2025 |
29.26 (-2.04%) |
29.86 |
28.94 - 30.11 |
0.6154 times |
Fri 19 September 2025 |
29.87 (-0.1%) |
30.03 |
28.64 - 30.41 |
1.3829 times |
Fri 12 September 2025 |
29.90 (-0.3%) |
30.00 |
29.45 - 30.62 |
0.6308 times |
Fri 05 September 2025 |
29.99 (-1.12%) |
30.02 |
29.70 - 30.73 |
0.8558 times |
Fri 29 August 2025 |
30.33 (0%) |
30.25 |
30.18 - 30.68 |
0.1206 times |
Fri 29 August 2025 |
30.33 (2.09%) |
29.64 |
29.41 - 30.96 |
0.912 times |
Fri 22 August 2025 |
29.71 (5.32%) |
28.21 |
27.98 - 29.78 |
0.9508 times |
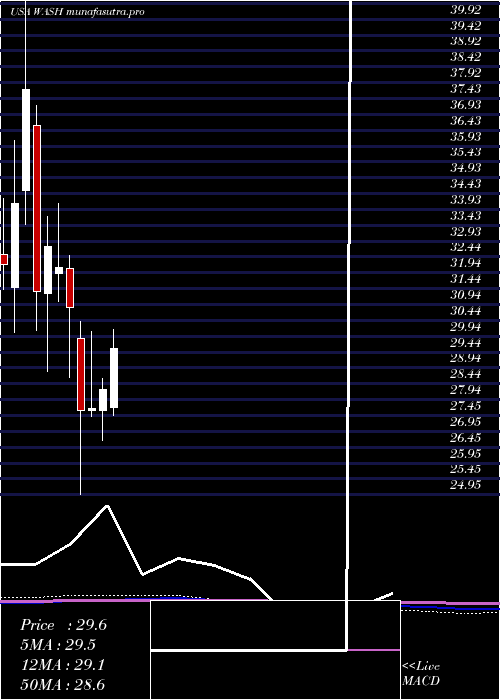
Monthly price and charts WashingtonTrust Strong monthly Stock price targets for WashingtonTrust WASH are 24.16 and 28.63 | Monthly Target 1 | 23.02 | | Monthly Target 2 | 25.29 | | Monthly Target 3 | 27.493333333333 | | Monthly Target 4 | 29.76 | | Monthly Target 5 | 31.96 |
Monthly price and volumes Washington Trust
| Date |
Closing |
Open |
Range |
Volume |
Tue 21 October 2025 |
27.55 (-4.67%) |
28.14 |
25.23 - 29.70 |
0.9428 times |
Tue 30 September 2025 |
28.90 (-4.71%) |
30.02 |
28.35 - 30.73 |
0.776 times |
Fri 29 August 2025 |
30.33 (12.58%) |
26.61 |
26.11 - 30.96 |
0.8098 times |
Thu 31 July 2025 |
26.94 (-4.74%) |
27.69 |
26.66 - 30.30 |
1.0712 times |
Mon 30 June 2025 |
28.28 (2.24%) |
27.61 |
26.66 - 28.62 |
0.8766 times |
Fri 30 May 2025 |
27.66 (0.22%) |
27.60 |
27.40 - 30.08 |
0.7482 times |
Wed 30 April 2025 |
27.60 (-10.56%) |
29.86 |
24.95 - 30.40 |
1.4067 times |
Mon 31 March 2025 |
30.86 (-3.92%) |
32.07 |
28.64 - 32.49 |
1.067 times |
Fri 28 February 2025 |
32.12 (-1.98%) |
31.90 |
31.04 - 34.13 |
0.9471 times |
Fri 31 January 2025 |
32.77 (4.53%) |
31.29 |
28.84 - 33.70 |
1.3547 times |
Tue 31 December 2024 |
31.35 (-16.87%) |
36.56 |
30.13 - 37.20 |
1.5408 times |
DMA SMA EMA moving averages of Washington Trust WASH
DMA (daily moving average) of Washington Trust WASH
| DMA period | DMA value | | 5 day DMA | 26.52 | | 12 day DMA | 27.17 | | 20 day DMA | 27.85 | | 35 day DMA | 28.68 | | 50 day DMA | 28.88 | | 100 day DMA | 28.46 | | 150 day DMA | 28.44 | | 200 day DMA | 29.27 | EMA (exponential moving average) of Washington Trust WASH
| EMA period | EMA current | EMA prev | EMA prev2 | | 5 day EMA | 26.84 | 26.48 | 26.3 | | 12 day EMA | 27.16 | 27.09 | 27.14 | | 20 day EMA | 27.61 | 27.62 | 27.7 | | 35 day EMA | 28.08 | 28.11 | 28.19 | | 50 day EMA | 28.55 | 28.59 | 28.66 |
SMA (simple moving average) of Washington Trust WASH
| SMA period | SMA current | SMA prev | SMA prev2 | | 5 day SMA | 26.52 | 26.42 | 26.37 | | 12 day SMA | 27.17 | 27.28 | 27.4 | | 20 day SMA | 27.85 | 27.94 | 28.08 | | 35 day SMA | 28.68 | 28.75 | 28.85 | | 50 day SMA | 28.88 | 28.91 | 28.92 | | 100 day SMA | 28.46 | 28.46 | 28.48 | | 150 day SMA | 28.44 | 28.46 | 28.49 | | 200 day SMA | 29.27 | 29.28 | 29.3 |
|
|
