WashingtonFederal WAFD full analysis,charts,indicators,moving averages,SMA,DMA,EMA,ADX,MACD,RSIWashington Federal WAFD WideScreen charts, DMA,SMA,EMA technical analysis, forecast prediction, by indicators ADX,MACD,RSI,CCI USA stock exchange
operates under Finance sector & deals in Major Banks
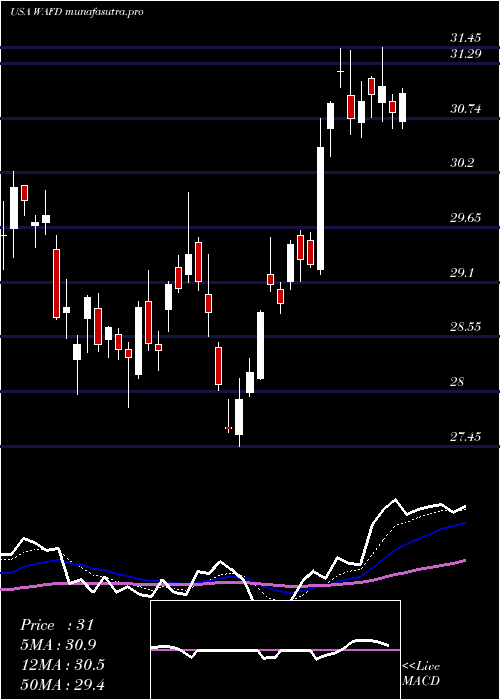
Daily price and charts and targets WashingtonFederal Strong Daily Stock price targets for WashingtonFederal WAFD are 28.51 and 29.79 | Daily Target 1 | 27.46 | | Daily Target 2 | 28.28 | | Daily Target 3 | 28.736666666667 | | Daily Target 4 | 29.56 | | Daily Target 5 | 30.02 |
Daily price and volume Washington Federal
| Date |
Closing |
Open |
Range |
Volume |
Mon 20 October 2025 |
29.11 (3.71%) |
28.07 |
27.91 - 29.19 |
0.9231 times |
Fri 17 October 2025 |
28.07 (0.86%) |
27.70 |
26.31 - 28.39 |
1.4703 times |
Thu 16 October 2025 |
27.83 (-3.67%) |
28.47 |
27.60 - 28.60 |
1.5286 times |
Wed 15 October 2025 |
28.89 (-2.69%) |
29.77 |
28.70 - 29.85 |
1.0139 times |
Tue 14 October 2025 |
29.69 (2.45%) |
28.84 |
28.84 - 29.87 |
0.7549 times |
Mon 13 October 2025 |
28.98 (1.29%) |
28.94 |
28.63 - 29.04 |
0.8568 times |
Fri 10 October 2025 |
28.61 (-1.04%) |
29.16 |
28.48 - 29.24 |
1.2328 times |
Thu 09 October 2025 |
28.91 (-0.86%) |
29.14 |
28.60 - 29.14 |
0.7426 times |
Wed 08 October 2025 |
29.16 (-0.82%) |
29.58 |
29.11 - 29.70 |
0.6788 times |
Tue 07 October 2025 |
29.40 (-1.71%) |
29.98 |
29.36 - 30.15 |
0.7982 times |
Mon 06 October 2025 |
29.91 (-0.2%) |
30.10 |
29.65 - 30.43 |
0.5727 times |
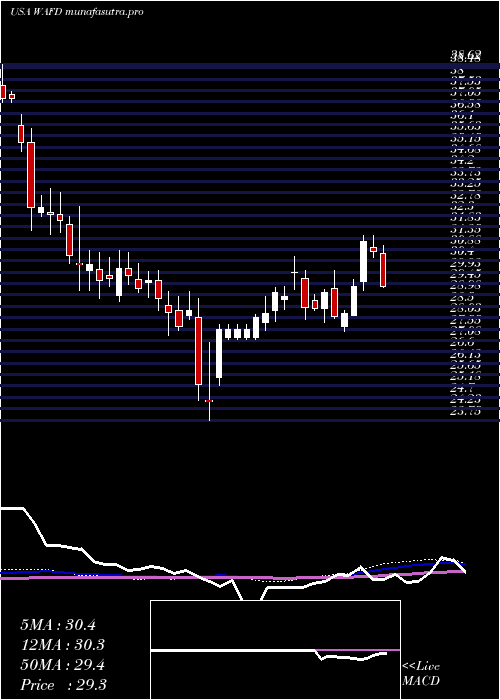
Weekly price and charts WashingtonFederal Strong weekly Stock price targets for WashingtonFederal WAFD are 28.51 and 29.79 | Weekly Target 1 | 27.46 | | Weekly Target 2 | 28.28 | | Weekly Target 3 | 28.736666666667 | | Weekly Target 4 | 29.56 | | Weekly Target 5 | 30.02 |
Weekly price and volumes for Washington Federal
| Date |
Closing |
Open |
Range |
Volume |
Mon 20 October 2025 |
29.11 (3.71%) |
28.07 |
27.91 - 29.19 |
0.2695 times |
Fri 17 October 2025 |
28.07 (-1.89%) |
28.94 |
26.31 - 29.87 |
1.6424 times |
Fri 10 October 2025 |
28.61 (-4.54%) |
30.10 |
28.48 - 30.43 |
1.1753 times |
Fri 03 October 2025 |
29.97 (-3.2%) |
30.99 |
29.63 - 30.99 |
1.0604 times |
Fri 26 September 2025 |
30.96 (-1.5%) |
31.38 |
30.59 - 31.78 |
0.9531 times |
Fri 19 September 2025 |
31.43 (0.58%) |
31.25 |
30.38 - 32.01 |
2.2302 times |
Fri 12 September 2025 |
31.25 (-1.57%) |
31.83 |
31.16 - 31.84 |
0.9547 times |
Fri 05 September 2025 |
31.75 (0.95%) |
31.14 |
30.94 - 32.49 |
0.6667 times |
Fri 29 August 2025 |
31.45 (0%) |
31.65 |
31.40 - 31.78 |
0.1424 times |
Fri 29 August 2025 |
31.45 (-0.88%) |
31.73 |
31.15 - 32.13 |
0.9053 times |
Fri 22 August 2025 |
31.73 (3.79%) |
30.54 |
30.29 - 31.86 |
0.8967 times |
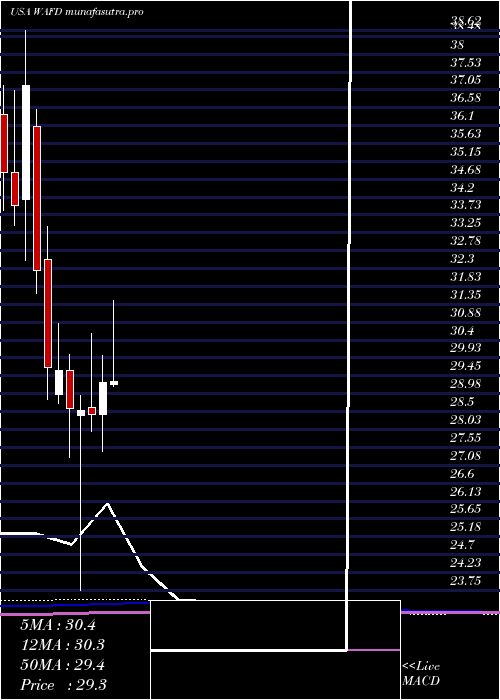
Monthly price and charts WashingtonFederal Strong monthly Stock price targets for WashingtonFederal WAFD are 25.6 and 29.82 | Monthly Target 1 | 24.43 | | Monthly Target 2 | 26.77 | | Monthly Target 3 | 28.65 | | Monthly Target 4 | 30.99 | | Monthly Target 5 | 32.87 |
Monthly price and volumes Washington Federal
| Date |
Closing |
Open |
Range |
Volume |
Mon 20 October 2025 |
29.11 (-3.9%) |
30.09 |
26.31 - 30.53 |
0.6595 times |
Tue 30 September 2025 |
30.29 (-3.69%) |
31.14 |
29.93 - 32.49 |
0.9211 times |
Fri 29 August 2025 |
31.45 (8.04%) |
28.67 |
28.42 - 32.13 |
0.8073 times |
Thu 31 July 2025 |
29.11 (-0.58%) |
29.22 |
28.62 - 31.45 |
1.1628 times |
Mon 30 June 2025 |
29.28 (3.03%) |
28.42 |
27.45 - 30.00 |
0.7916 times |
Fri 30 May 2025 |
28.42 (-0.39%) |
28.60 |
27.97 - 30.58 |
1.0212 times |
Wed 30 April 2025 |
28.53 (-0.17%) |
28.39 |
23.75 - 28.93 |
1.2157 times |
Mon 31 March 2025 |
28.58 (-3.41%) |
29.59 |
27.28 - 30.01 |
1.3009 times |
Fri 28 February 2025 |
29.59 (-0.3%) |
28.96 |
28.72 - 30.84 |
0.8506 times |
Fri 31 January 2025 |
29.68 (-7.94%) |
32.53 |
28.82 - 33.43 |
1.2692 times |
Tue 31 December 2024 |
32.24 (-13.26%) |
36.07 |
31.65 - 36.53 |
0.6803 times |
DMA SMA EMA moving averages of Washington Federal WAFD
DMA (daily moving average) of Washington Federal WAFD
| DMA period | DMA value | | 5 day DMA | 28.72 | | 12 day DMA | 29.04 | | 20 day DMA | 29.64 | | 35 day DMA | 30.4 | | 50 day DMA | 30.62 | | 100 day DMA | 30.03 | | 150 day DMA | 29.38 | | 200 day DMA | 29.52 | EMA (exponential moving average) of Washington Federal WAFD
| EMA period | EMA current | EMA prev | EMA prev2 | | 5 day EMA | 28.7 | 28.5 | 28.71 | | 12 day EMA | 29.08 | 29.07 | 29.25 | | 20 day EMA | 29.47 | 29.51 | 29.66 | | 35 day EMA | 29.91 | 29.96 | 30.07 | | 50 day EMA | 30.35 | 30.4 | 30.49 |
SMA (simple moving average) of Washington Federal WAFD
| SMA period | SMA current | SMA prev | SMA prev2 | | 5 day SMA | 28.72 | 28.69 | 28.8 | | 12 day SMA | 29.04 | 29.11 | 29.27 | | 20 day SMA | 29.64 | 29.75 | 29.92 | | 35 day SMA | 30.4 | 30.47 | 30.57 | | 50 day SMA | 30.62 | 30.63 | 30.67 | | 100 day SMA | 30.03 | 30.03 | 30.03 | | 150 day SMA | 29.38 | 29.38 | 29.38 | | 200 day SMA | 29.52 | 29.54 | 29.56 |
|
|
