VerizonCommunications VZ full analysis,charts,indicators,moving averages,SMA,DMA,EMA,ADX,MACD,RSIVerizon Communications VZ WideScreen charts, DMA,SMA,EMA technical analysis, forecast prediction, by indicators ADX,MACD,RSI,CCI USA stock exchange
operates under Public Utilities sector & deals in Telecommunications Equipment
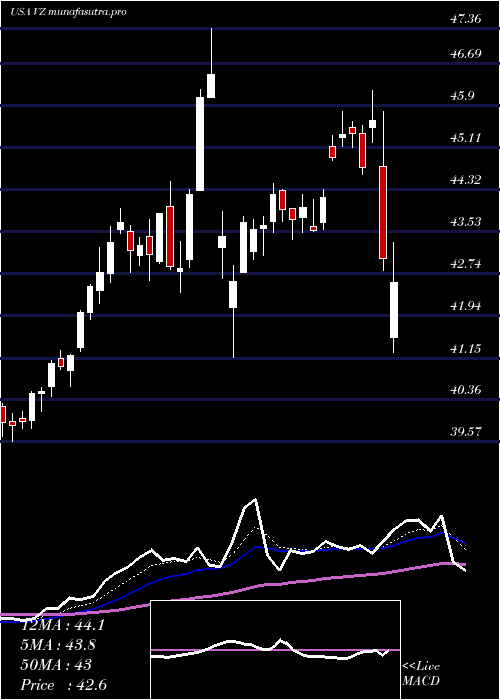
Daily price and charts and targets VerizonCommunications Strong Daily Stock price targets for VerizonCommunications VZ are 40.99 and 41.64 | Daily Target 1 | 40.46 | | Daily Target 2 | 40.87 | | Daily Target 3 | 41.11 | | Daily Target 4 | 41.52 | | Daily Target 5 | 41.76 |
Daily price and volume Verizon Communications
| Date |
Closing |
Open |
Range |
Volume |
Thu 04 December 2025 |
41.28 (1.5%) |
40.77 |
40.70 - 41.35 |
0.95 times |
Wed 03 December 2025 |
40.67 (0.12%) |
40.74 |
40.66 - 41.32 |
0.9838 times |
Tue 02 December 2025 |
40.62 (-0.29%) |
40.79 |
40.36 - 40.81 |
0.7286 times |
Mon 01 December 2025 |
40.74 (-0.9%) |
40.96 |
40.68 - 41.09 |
0.9712 times |
Fri 28 November 2025 |
41.11 (0.56%) |
40.82 |
40.71 - 41.13 |
0.4905 times |
Wed 26 November 2025 |
40.88 (0.66%) |
40.59 |
40.56 - 40.97 |
0.7504 times |
Tue 25 November 2025 |
40.61 (0.97%) |
40.28 |
40.28 - 40.80 |
0.8208 times |
Mon 24 November 2025 |
40.22 (-2.45%) |
41.24 |
40.15 - 41.46 |
1.1322 times |
Fri 21 November 2025 |
41.23 (1.15%) |
40.67 |
40.42 - 41.61 |
1.5828 times |
Thu 20 November 2025 |
40.76 (-1.04%) |
41.15 |
40.65 - 41.44 |
1.5898 times |
Wed 19 November 2025 |
41.19 (-0.7%) |
41.50 |
40.94 - 41.61 |
1.0819 times |
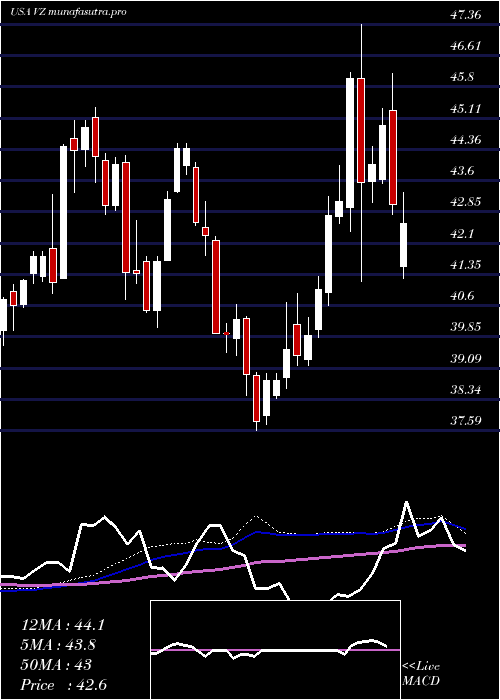
Weekly price and charts VerizonCommunications Strong weekly Stock price targets for VerizonCommunications VZ are 40.82 and 41.81 | Weekly Target 1 | 40.01 | | Weekly Target 2 | 40.64 | | Weekly Target 3 | 40.996666666667 | | Weekly Target 4 | 41.63 | | Weekly Target 5 | 41.99 |
Weekly price and volumes for Verizon Communications
| Date |
Closing |
Open |
Range |
Volume |
Thu 04 December 2025 |
41.28 (0.41%) |
40.96 |
40.36 - 41.35 |
0.6209 times |
Fri 28 November 2025 |
41.11 (-0.29%) |
41.24 |
40.15 - 41.46 |
0.5457 times |
Fri 21 November 2025 |
41.23 (0.41%) |
41.06 |
40.42 - 41.61 |
1.0627 times |
Fri 14 November 2025 |
41.06 (2.57%) |
39.90 |
39.57 - 41.73 |
0.9606 times |
Fri 07 November 2025 |
40.03 (0.73%) |
39.51 |
39.17 - 40.32 |
0.8169 times |
Fri 31 October 2025 |
39.74 (0%) |
38.98 |
38.78 - 39.96 |
0.4406 times |
Fri 31 October 2025 |
39.74 (2.32%) |
38.81 |
38.77 - 41.32 |
1.785 times |
Fri 24 October 2025 |
38.84 (-4.45%) |
40.68 |
38.39 - 40.87 |
1.1586 times |
Fri 17 October 2025 |
40.65 (2.01%) |
39.75 |
39.41 - 41.00 |
0.8372 times |
Fri 10 October 2025 |
39.85 (-9.12%) |
43.83 |
39.82 - 44.55 |
1.7718 times |
Fri 03 October 2025 |
43.85 (0.55%) |
43.60 |
43.09 - 44.09 |
0.8 times |
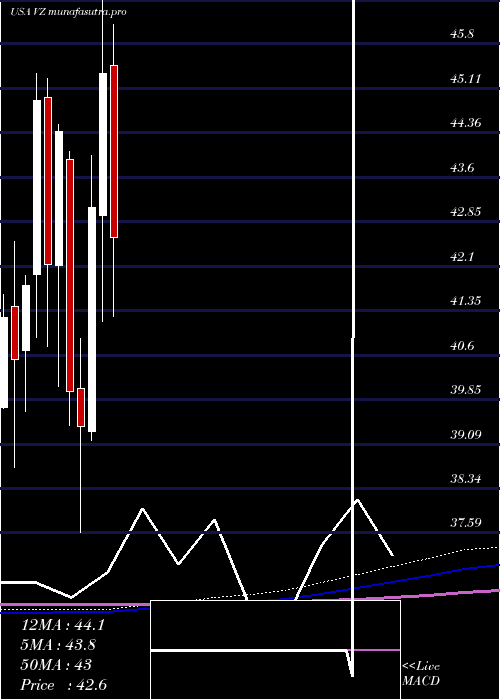
Monthly price and charts VerizonCommunications Strong monthly Stock price targets for VerizonCommunications VZ are 40.82 and 41.81 | Monthly Target 1 | 40.01 | | Monthly Target 2 | 40.64 | | Monthly Target 3 | 40.996666666667 | | Monthly Target 4 | 41.63 | | Monthly Target 5 | 41.99 |
Monthly price and volumes Verizon Communications
| Date |
Closing |
Open |
Range |
Volume |
Thu 04 December 2025 |
41.28 (0.41%) |
40.96 |
40.36 - 41.35 |
0.1782 times |
Fri 28 November 2025 |
41.11 (3.45%) |
39.51 |
39.17 - 41.73 |
0.9716 times |
Fri 31 October 2025 |
39.74 (-9.58%) |
43.92 |
38.39 - 44.55 |
1.8519 times |
Tue 30 September 2025 |
43.95 (-0.63%) |
44.16 |
42.88 - 44.48 |
0.9212 times |
Fri 29 August 2025 |
44.23 (3.44%) |
43.29 |
42.17 - 45.75 |
0.7924 times |
Thu 31 July 2025 |
42.76 (-1.18%) |
43.42 |
40.69 - 44.03 |
1.0653 times |
Mon 30 June 2025 |
43.27 (-1.57%) |
43.80 |
41.60 - 44.40 |
0.7909 times |
Fri 30 May 2025 |
43.96 (-0.23%) |
43.77 |
42.25 - 44.55 |
0.7645 times |
Wed 30 April 2025 |
44.06 (-2.87%) |
45.49 |
40.88 - 46.19 |
1.3014 times |
Mon 31 March 2025 |
45.36 (5.24%) |
42.96 |
41.17 - 47.36 |
1.3626 times |
Fri 28 February 2025 |
43.10 (9.42%) |
39.31 |
39.15 - 43.97 |
0.893 times |
DMA SMA EMA moving averages of Verizon Communications VZ
DMA (daily moving average) of Verizon Communications VZ
| DMA period | DMA value | | 5 day DMA | 40.88 | | 12 day DMA | 40.9 | | 20 day DMA | 40.76 | | 35 day DMA | 40.3 | | 50 day DMA | 40.83 | | 100 day DMA | 42.13 | | 150 day DMA | 42.46 | | 200 day DMA | 42.76 | EMA (exponential moving average) of Verizon Communications VZ
| EMA period | EMA current | EMA prev | EMA prev2 | | 5 day EMA | 40.92 | 40.74 | 40.77 | | 12 day EMA | 40.82 | 40.74 | 40.75 | | 20 day EMA | 40.76 | 40.7 | 40.7 | | 35 day EMA | 40.94 | 40.92 | 40.94 | | 50 day EMA | 41.05 | 41.04 | 41.05 |
SMA (simple moving average) of Verizon Communications VZ
| SMA period | SMA current | SMA prev | SMA prev2 | | 5 day SMA | 40.88 | 40.8 | 40.79 | | 12 day SMA | 40.9 | 40.88 | 40.91 | | 20 day SMA | 40.76 | 40.68 | 40.61 | | 35 day SMA | 40.3 | 40.28 | 40.27 | | 50 day SMA | 40.83 | 40.87 | 40.93 | | 100 day SMA | 42.13 | 42.13 | 42.14 | | 150 day SMA | 42.46 | 42.48 | 42.49 | | 200 day SMA | 42.76 | 42.77 | 42.77 |
|
|
