VanguardTotal VXUS full analysis,charts,indicators,moving averages,SMA,DMA,EMA,ADX,MACD,RSIVanguard Total VXUS WideScreen charts, DMA,SMA,EMA technical analysis, forecast prediction, by indicators ADX,MACD,RSI,CCI USA stock exchange
operates under N A sector & deals in N A
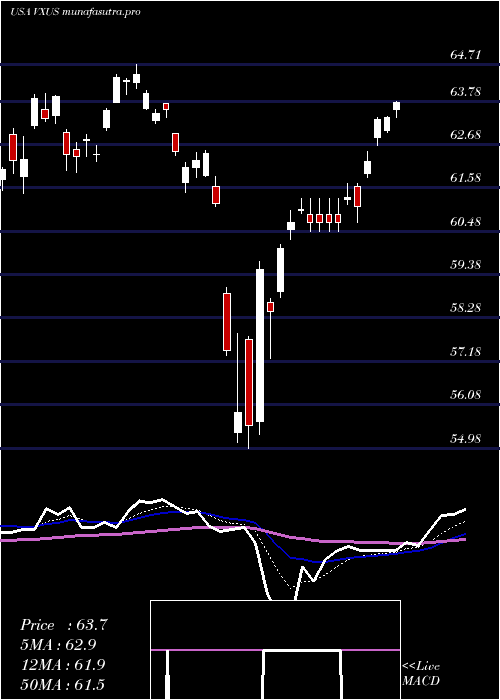
Daily price and charts and targets VanguardTotal Strong Daily Stock price targets for VanguardTotal VXUS are 74.06 and 74.37 | Daily Target 1 | 74.01 | | Daily Target 2 | 74.11 | | Daily Target 3 | 74.316666666667 | | Daily Target 4 | 74.42 | | Daily Target 5 | 74.63 |
Daily price and volume Vanguard Total
| Date |
Closing |
Open |
Range |
Volume |
Tue 21 October 2025 |
74.22 (-0.93%) |
74.48 |
74.21 - 74.52 |
0.8936 times |
Mon 20 October 2025 |
74.92 (0.97%) |
74.55 |
74.36 - 74.98 |
0.9585 times |
Fri 17 October 2025 |
74.20 (0%) |
73.89 |
73.78 - 74.29 |
0.7502 times |
Thu 16 October 2025 |
74.20 (0.38%) |
74.26 |
74.02 - 74.78 |
0.8687 times |
Wed 15 October 2025 |
73.92 (0.87%) |
73.87 |
73.46 - 74.09 |
1.0067 times |
Tue 14 October 2025 |
73.28 (0.01%) |
72.60 |
72.48 - 73.55 |
1.061 times |
Mon 13 October 2025 |
73.27 (1.52%) |
73.10 |
72.90 - 73.40 |
0.771 times |
Fri 10 October 2025 |
72.17 (-2.31%) |
73.79 |
72.08 - 73.84 |
1.5318 times |
Thu 09 October 2025 |
73.88 (-0.87%) |
74.59 |
73.71 - 74.61 |
1.1167 times |
Wed 08 October 2025 |
74.53 (0.39%) |
74.40 |
74.31 - 74.54 |
1.0418 times |
Tue 07 October 2025 |
74.24 (-0.88%) |
74.76 |
74.22 - 74.80 |
1.1613 times |
Weekly price and charts VanguardTotal Strong weekly Stock price targets for VanguardTotal VXUS are 73.83 and 74.6 | Weekly Target 1 | 73.7 | | Weekly Target 2 | 73.96 | | Weekly Target 3 | 74.47 | | Weekly Target 4 | 74.73 | | Weekly Target 5 | 75.24 |
Weekly price and volumes for Vanguard Total
| Date |
Closing |
Open |
Range |
Volume |
Tue 21 October 2025 |
74.22 (0.03%) |
74.55 |
74.21 - 74.98 |
0.423 times |
Fri 17 October 2025 |
74.20 (2.81%) |
73.10 |
72.48 - 74.78 |
1.0181 times |
Fri 10 October 2025 |
72.17 (-3.52%) |
74.88 |
72.08 - 75.00 |
1.3896 times |
Fri 03 October 2025 |
74.80 (2.82%) |
73.10 |
73.01 - 74.96 |
1.2099 times |
Fri 26 September 2025 |
72.75 (-0.51%) |
73.21 |
72.21 - 73.74 |
1.4731 times |
Fri 19 September 2025 |
73.12 (0.04%) |
73.49 |
73.03 - 74.21 |
1.0992 times |
Fri 12 September 2025 |
73.09 (1.83%) |
72.35 |
72.11 - 73.36 |
1.0777 times |
Fri 05 September 2025 |
71.78 (0.57%) |
70.43 |
70.36 - 72.15 |
1.016 times |
Fri 29 August 2025 |
71.37 (0%) |
71.33 |
71.19 - 71.45 |
0.2535 times |
Fri 29 August 2025 |
71.37 (-1.35%) |
72.14 |
70.98 - 72.24 |
1.0397 times |
Fri 22 August 2025 |
72.35 (1.25%) |
71.46 |
71.04 - 72.46 |
1.1082 times |
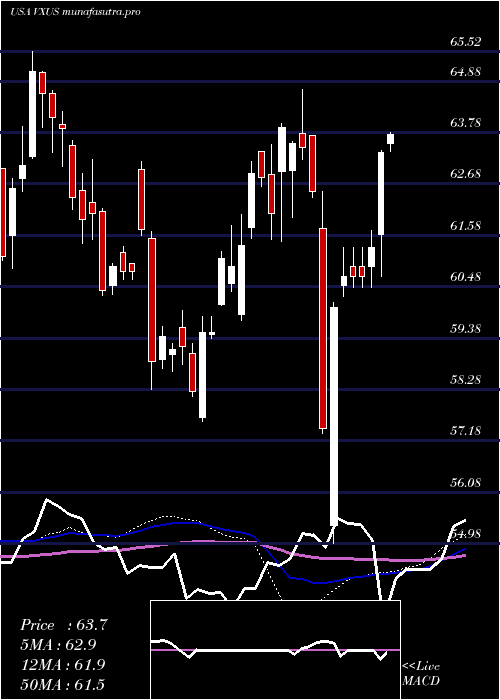
Monthly price and charts VanguardTotal Strong monthly Stock price targets for VanguardTotal VXUS are 73.15 and 76.07 | Monthly Target 1 | 70.85 | | Monthly Target 2 | 72.53 | | Monthly Target 3 | 73.766666666667 | | Monthly Target 4 | 75.45 | | Monthly Target 5 | 76.69 |
Monthly price and volumes Vanguard Total
| Date |
Closing |
Open |
Range |
Volume |
Tue 21 October 2025 |
74.22 (1.03%) |
73.78 |
72.08 - 75.00 |
0.773 times |
Tue 30 September 2025 |
73.46 (2.93%) |
70.43 |
70.36 - 74.21 |
1.0941 times |
Fri 29 August 2025 |
71.37 (4.24%) |
68.41 |
67.85 - 72.46 |
0.9574 times |
Thu 31 July 2025 |
68.47 (-0.9%) |
69.02 |
68.36 - 71.08 |
1.0348 times |
Mon 30 June 2025 |
69.09 (3.21%) |
67.19 |
66.25 - 69.14 |
1.0873 times |
Fri 30 May 2025 |
66.94 (4.82%) |
63.99 |
63.64 - 67.49 |
0.9441 times |
Wed 30 April 2025 |
63.86 (2.83%) |
62.09 |
54.98 - 64.04 |
1.337 times |
Mon 31 March 2025 |
62.10 (0.08%) |
62.94 |
61.44 - 64.71 |
1.0279 times |
Fri 28 February 2025 |
62.05 (1.85%) |
59.89 |
59.75 - 63.53 |
0.7767 times |
Fri 31 January 2025 |
60.92 (3.38%) |
59.07 |
57.58 - 61.79 |
0.9679 times |
Tue 31 December 2024 |
58.93 (-3.08%) |
62.98 |
58.29 - 63.17 |
0.745 times |

DMA SMA EMA moving averages of Vanguard Total VXUS
DMA (daily moving average) of Vanguard Total VXUS
| DMA period | DMA value | | 5 day DMA | 74.29 | | 12 day DMA | 73.98 | | 20 day DMA | 73.78 | | 35 day DMA | 73.37 | | 50 day DMA | 72.8 | | 100 day DMA | 70.82 | | 150 day DMA | 68.28 | | 200 day DMA | 66.55 | EMA (exponential moving average) of Vanguard Total VXUS
| EMA period | EMA current | EMA prev | EMA prev2 | | 5 day EMA | 74.24 | 74.25 | 73.92 | | 12 day EMA | 74 | 73.96 | 73.79 | | 20 day EMA | 73.77 | 73.72 | 73.59 | | 35 day EMA | 73.25 | 73.19 | 73.09 | | 50 day EMA | 72.75 | 72.69 | 72.6 |
SMA (simple moving average) of Vanguard Total VXUS
| SMA period | SMA current | SMA prev | SMA prev2 | | 5 day SMA | 74.29 | 74.1 | 73.77 | | 12 day SMA | 73.98 | 74.03 | 73.97 | | 20 day SMA | 73.78 | 73.73 | 73.66 | | 35 day SMA | 73.37 | 73.28 | 73.18 | | 50 day SMA | 72.8 | 72.74 | 72.64 | | 100 day SMA | 70.82 | 70.75 | 70.67 | | 150 day SMA | 68.28 | 68.21 | 68.12 | | 200 day SMA | 66.55 | 66.47 | 66.39 |
|
|
