VaxartInc VXRT full analysis,charts,indicators,moving averages,SMA,DMA,EMA,ADX,MACD,RSIVaxart Inc VXRT WideScreen charts, DMA,SMA,EMA technical analysis, forecast prediction, by indicators ADX,MACD,RSI,CCI USA stock exchange
operates under Health Care sector & deals in Biotechnology Biological Products No Diagnostic Substances
Daily price and charts and targets VaxartInc Strong Daily Stock price targets for VaxartInc VXRT are 0.25 and 0.38 | Daily Target 1 | 0.22 | | Daily Target 2 | 0.27 | | Daily Target 3 | 0.35 | | Daily Target 4 | 0.4 | | Daily Target 5 | 0.48 |
Daily price and volume Vaxart Inc
| Date |
Closing |
Open |
Range |
Volume |
Mon 07 July 2025 |
0.32 (-25.58%) |
0.41 |
0.30 - 0.43 |
5.3163 times |
Thu 03 July 2025 |
0.43 (-2.27%) |
0.44 |
0.43 - 0.45 |
0.3584 times |
Wed 02 July 2025 |
0.44 (-4.35%) |
0.43 |
0.42 - 0.47 |
0.8105 times |
Tue 01 July 2025 |
0.46 (2.22%) |
0.48 |
0.44 - 0.48 |
0.6128 times |
Mon 30 June 2025 |
0.45 (-8.16%) |
0.51 |
0.45 - 0.51 |
0.6022 times |
Fri 27 June 2025 |
0.49 (-7.55%) |
0.54 |
0.48 - 0.54 |
0.6353 times |
Thu 26 June 2025 |
0.53 (-1.85%) |
0.53 |
0.51 - 0.54 |
0.2273 times |
Wed 25 June 2025 |
0.54 (-3.57%) |
0.55 |
0.52 - 0.58 |
0.4167 times |
Tue 24 June 2025 |
0.56 (0%) |
0.56 |
0.55 - 0.60 |
0.5979 times |
Mon 23 June 2025 |
0.56 (-3.45%) |
0.57 |
0.54 - 0.59 |
0.4225 times |
Fri 20 June 2025 |
0.58 (-4.92%) |
0.63 |
0.58 - 0.64 |
0.5712 times |
Weekly price and charts VaxartInc Strong weekly Stock price targets for VaxartInc VXRT are 0.25 and 0.38 | Weekly Target 1 | 0.22 | | Weekly Target 2 | 0.27 | | Weekly Target 3 | 0.35 | | Weekly Target 4 | 0.4 | | Weekly Target 5 | 0.48 |
Weekly price and volumes for Vaxart Inc
| Date |
Closing |
Open |
Range |
Volume |
Mon 07 July 2025 |
0.32 (-25.58%) |
0.41 |
0.30 - 0.43 |
0.9656 times |
Thu 03 July 2025 |
0.43 (-12.24%) |
0.51 |
0.42 - 0.51 |
0.433 times |
Fri 27 June 2025 |
0.49 (-15.52%) |
0.57 |
0.48 - 0.60 |
0.4177 times |
Fri 20 June 2025 |
0.58 (-17.14%) |
0.65 |
0.58 - 0.68 |
0.3579 times |
Fri 13 June 2025 |
0.70 (70.73%) |
0.40 |
0.38 - 0.78 |
6.1196 times |
Fri 06 June 2025 |
0.41 (-4.65%) |
0.43 |
0.39 - 0.47 |
0.2865 times |
Fri 30 May 2025 |
0.43 (-6.52%) |
0.47 |
0.42 - 0.48 |
0.2458 times |
Fri 23 May 2025 |
0.46 (-9.8%) |
0.48 |
0.45 - 0.53 |
0.2863 times |
Fri 16 May 2025 |
0.51 (21.43%) |
0.42 |
0.37 - 0.54 |
0.6366 times |
Fri 09 May 2025 |
0.42 (-6.67%) |
0.45 |
0.37 - 0.46 |
0.2511 times |
Fri 02 May 2025 |
0.45 (12.5%) |
0.44 |
0.39 - 0.48 |
0.4536 times |

Monthly price and charts VaxartInc Strong monthly Stock price targets for VaxartInc VXRT are 0.22 and 0.4 | Monthly Target 1 | 0.19 | | Monthly Target 2 | 0.25 | | Monthly Target 3 | 0.36666666666667 | | Monthly Target 4 | 0.43 | | Monthly Target 5 | 0.55 |
Monthly price and volumes Vaxart Inc
| Date |
Closing |
Open |
Range |
Volume |
Mon 07 July 2025 |
0.32 (-28.89%) |
0.48 |
0.30 - 0.48 |
0.6546 times |
Mon 30 June 2025 |
0.45 (4.65%) |
0.43 |
0.38 - 0.78 |
3.7024 times |
Fri 30 May 2025 |
0.43 (-2.27%) |
0.44 |
0.37 - 0.54 |
0.759 times |
Wed 30 April 2025 |
0.44 (7.32%) |
0.40 |
0.29 - 0.48 |
0.808 times |
Mon 31 March 2025 |
0.41 (-19.61%) |
0.50 |
0.39 - 0.60 |
0.6516 times |
Fri 28 February 2025 |
0.51 (-25%) |
0.65 |
0.45 - 0.78 |
0.7989 times |
Fri 31 January 2025 |
0.68 (3.03%) |
0.67 |
0.66 - 0.98 |
0.8739 times |
Tue 31 December 2024 |
0.66 (10%) |
0.64 |
0.53 - 0.78 |
0.641 times |
Tue 26 November 2024 |
0.60 (-22.08%) |
0.77 |
0.58 - 0.80 |
0.6689 times |
Thu 31 October 2024 |
0.77 (-9.41%) |
0.85 |
0.75 - 0.88 |
0.4415 times |
Mon 30 September 2024 |
0.85 (-1.16%) |
0.85 |
0.77 - 1.07 |
0.6367 times |

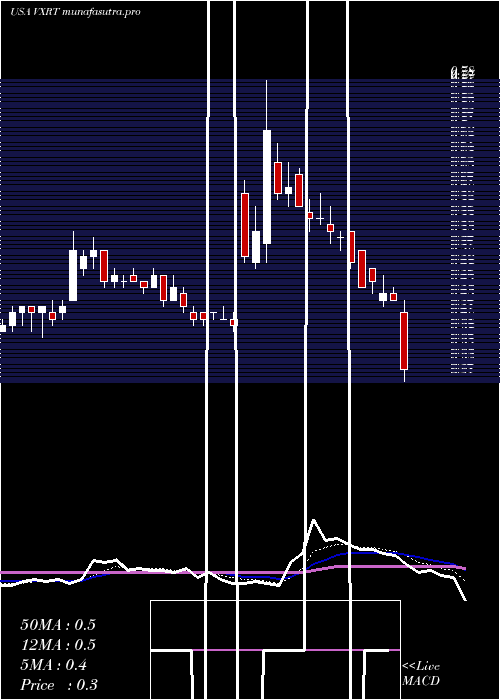
DMA SMA EMA moving averages of Vaxart Inc VXRT
DMA (daily moving average) of Vaxart Inc VXRT
| DMA period | DMA value | | 5 day DMA | 0.42 | | 12 day DMA | 0.5 | | 20 day DMA | 0.5 | | 35 day DMA | 0.48 | | 50 day DMA | 0.46 | | 100 day DMA | 0.47 | | 150 day DMA | 0.55 | | 200 day DMA | 0.61 | EMA (exponential moving average) of Vaxart Inc VXRT
| EMA period | EMA current | EMA prev | EMA prev2 | | 5 day EMA | 0.41 | 0.46 | 0.47 | | 12 day EMA | 0.46 | 0.49 | 0.5 | | 20 day EMA | 0.46 | 0.48 | 0.49 | | 35 day EMA | 0.47 | 0.48 | 0.48 | | 50 day EMA | 0.44 | 0.45 | 0.45 |
SMA (simple moving average) of Vaxart Inc VXRT
| SMA period | SMA current | SMA prev | SMA prev2 | | 5 day SMA | 0.42 | 0.45 | 0.47 | | 12 day SMA | 0.5 | 0.52 | 0.54 | | 20 day SMA | 0.5 | 0.5 | 0.5 | | 35 day SMA | 0.48 | 0.48 | 0.48 | | 50 day SMA | 0.46 | 0.46 | 0.46 | | 100 day SMA | 0.47 | 0.48 | 0.48 | | 150 day SMA | 0.55 | 0.55 | 0.55 | | 200 day SMA | 0.61 | 0.61 | 0.61 |
|
|
