ValvolineInc VVV full analysis,charts,indicators,moving averages,SMA,DMA,EMA,ADX,MACD,RSIValvoline Inc VVV WideScreen charts, DMA,SMA,EMA technical analysis, forecast prediction, by indicators ADX,MACD,RSI,CCI USA stock exchange
operates under Basic Industries sector & deals in Major Chemicals
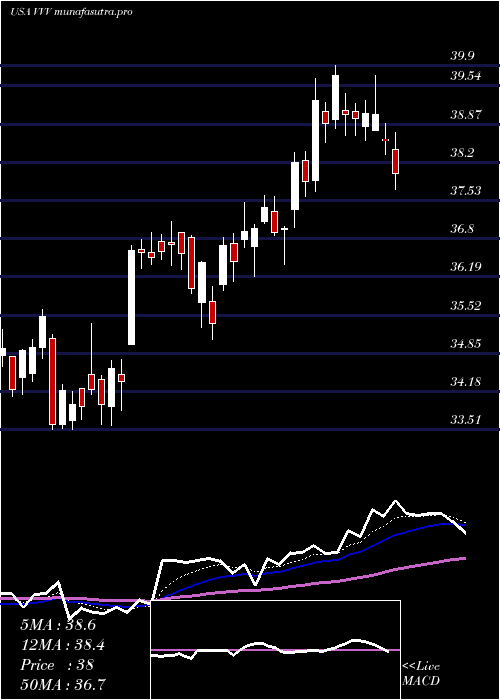
Daily price and charts and targets ValvolineInc Strong Daily Stock price targets for ValvolineInc VVV are 34.69 and 35.64 | Daily Target 1 | 33.94 | | Daily Target 2 | 34.49 | | Daily Target 3 | 34.893333333333 | | Daily Target 4 | 35.44 | | Daily Target 5 | 35.84 |
Daily price and volume Valvoline Inc
| Date |
Closing |
Open |
Range |
Volume |
Tue 21 October 2025 |
35.03 (0.37%) |
34.45 |
34.35 - 35.30 |
0.7448 times |
Mon 20 October 2025 |
34.90 (0.14%) |
34.91 |
34.67 - 35.03 |
0.6704 times |
Fri 17 October 2025 |
34.85 (0.72%) |
34.64 |
34.42 - 35.13 |
0.6153 times |
Thu 16 October 2025 |
34.60 (-1.76%) |
35.24 |
34.49 - 35.28 |
0.7954 times |
Wed 15 October 2025 |
35.22 (-0.87%) |
35.45 |
35.06 - 36.06 |
1.174 times |
Tue 14 October 2025 |
35.53 (0.79%) |
35.08 |
34.81 - 36.22 |
1.4147 times |
Mon 13 October 2025 |
35.25 (5.95%) |
33.50 |
33.49 - 35.31 |
1.537 times |
Fri 10 October 2025 |
33.27 (-2.15%) |
34.12 |
33.22 - 34.28 |
1.2802 times |
Thu 09 October 2025 |
34.00 (-1.36%) |
34.46 |
33.80 - 34.46 |
1.0407 times |
Wed 08 October 2025 |
34.47 (-0.4%) |
34.73 |
34.08 - 34.73 |
0.7275 times |
Tue 07 October 2025 |
34.61 (-1%) |
34.99 |
34.37 - 34.99 |
1.0378 times |
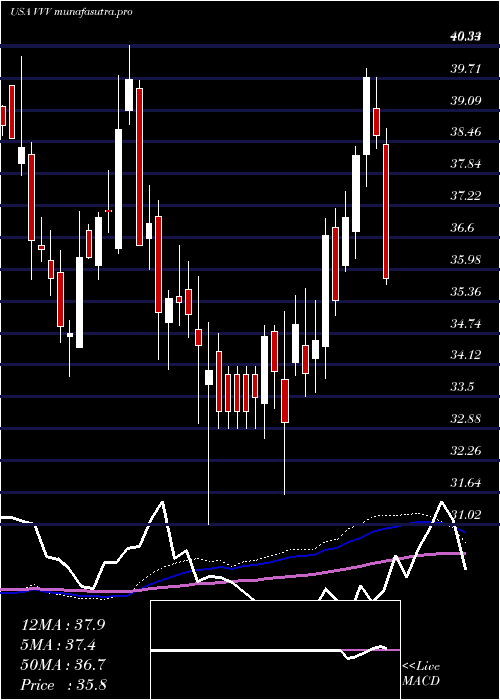
Weekly price and charts ValvolineInc Strong weekly Stock price targets for ValvolineInc VVV are 34.69 and 35.64 | Weekly Target 1 | 33.94 | | Weekly Target 2 | 34.49 | | Weekly Target 3 | 34.893333333333 | | Weekly Target 4 | 35.44 | | Weekly Target 5 | 35.84 |
Weekly price and volumes for Valvoline Inc
| Date |
Closing |
Open |
Range |
Volume |
Tue 21 October 2025 |
35.03 (0.52%) |
34.91 |
34.35 - 35.30 |
0.3406 times |
Fri 17 October 2025 |
34.85 (4.75%) |
33.50 |
33.49 - 36.22 |
1.3324 times |
Fri 10 October 2025 |
33.27 (-6.96%) |
35.75 |
33.22 - 35.86 |
1.2002 times |
Fri 03 October 2025 |
35.76 (-2.48%) |
36.89 |
35.31 - 36.89 |
1.2526 times |
Fri 26 September 2025 |
36.67 (-5.17%) |
38.84 |
36.09 - 38.84 |
1.2853 times |
Fri 19 September 2025 |
38.67 (-4.45%) |
40.46 |
38.64 - 41.33 |
1.2034 times |
Fri 12 September 2025 |
40.47 (3.66%) |
39.46 |
38.95 - 40.68 |
1.471 times |
Fri 05 September 2025 |
39.04 (0.67%) |
38.40 |
38.03 - 39.63 |
0.7118 times |
Fri 29 August 2025 |
38.78 (0%) |
39.14 |
38.61 - 39.19 |
0.224 times |
Fri 29 August 2025 |
38.78 (-2.69%) |
39.89 |
38.61 - 39.89 |
0.9787 times |
Fri 22 August 2025 |
39.85 (1.32%) |
40.00 |
38.47 - 40.12 |
1.0033 times |
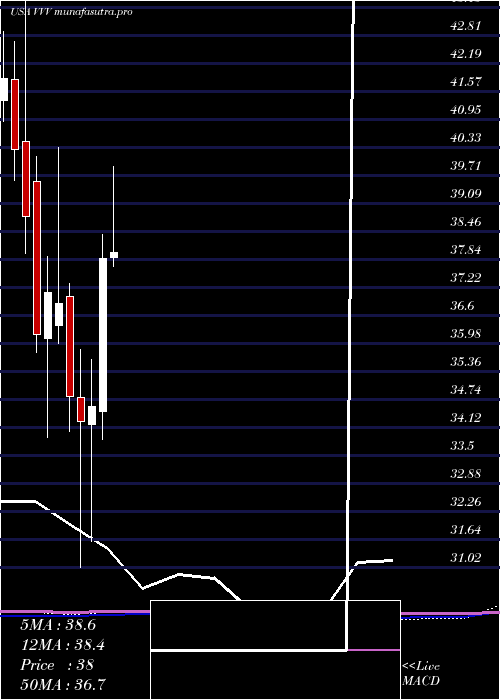
Monthly price and charts ValvolineInc Strong monthly Stock price targets for ValvolineInc VVV are 32.58 and 35.67 | Monthly Target 1 | 31.76 | | Monthly Target 2 | 33.4 | | Monthly Target 3 | 34.853333333333 | | Monthly Target 4 | 36.49 | | Monthly Target 5 | 37.94 |
Monthly price and volumes Valvoline Inc
| Date |
Closing |
Open |
Range |
Volume |
Tue 21 October 2025 |
35.03 (-2.45%) |
35.97 |
33.22 - 36.31 |
0.6995 times |
Tue 30 September 2025 |
35.91 (-7.4%) |
38.40 |
35.31 - 41.33 |
1.0652 times |
Fri 29 August 2025 |
38.78 (10.01%) |
35.17 |
34.46 - 40.12 |
1.0118 times |
Thu 31 July 2025 |
35.25 (-6.92%) |
37.88 |
34.97 - 39.90 |
1.182 times |
Mon 30 June 2025 |
37.87 (9.48%) |
34.48 |
33.85 - 38.40 |
1.162 times |
Fri 30 May 2025 |
34.59 (0.96%) |
34.19 |
31.59 - 35.62 |
1.1192 times |
Wed 30 April 2025 |
34.26 (-1.58%) |
34.78 |
31.02 - 35.85 |
1.006 times |
Mon 31 March 2025 |
34.81 (-5.61%) |
37.02 |
34.03 - 37.32 |
0.8438 times |
Fri 28 February 2025 |
36.88 (-0.62%) |
36.39 |
35.99 - 40.34 |
1.044 times |
Fri 31 January 2025 |
37.11 (2.57%) |
36.09 |
33.90 - 37.91 |
0.8665 times |
Tue 31 December 2024 |
36.18 (-6.73%) |
39.57 |
35.79 - 40.13 |
0.7302 times |
DMA SMA EMA moving averages of Valvoline Inc VVV
DMA (daily moving average) of Valvoline Inc VVV
| DMA period | DMA value | | 5 day DMA | 34.92 | | 12 day DMA | 34.72 | | 20 day DMA | 35.35 | | 35 day DMA | 37.1 | | 50 day DMA | 37.73 | | 100 day DMA | 37.36 | | 150 day DMA | 36.32 | | 200 day DMA | 36.42 | EMA (exponential moving average) of Valvoline Inc VVV
| EMA period | EMA current | EMA prev | EMA prev2 | | 5 day EMA | 34.92 | 34.87 | 34.86 | | 12 day EMA | 35.11 | 35.12 | 35.16 | | 20 day EMA | 35.61 | 35.67 | 35.75 | | 35 day EMA | 36.44 | 36.52 | 36.62 | | 50 day EMA | 37.52 | 37.62 | 37.73 |
SMA (simple moving average) of Valvoline Inc VVV
| SMA period | SMA current | SMA prev | SMA prev2 | | 5 day SMA | 34.92 | 35.02 | 35.09 | | 12 day SMA | 34.72 | 34.79 | 34.88 | | 20 day SMA | 35.35 | 35.47 | 35.6 | | 35 day SMA | 37.1 | 37.19 | 37.31 | | 50 day SMA | 37.73 | 37.81 | 37.88 | | 100 day SMA | 37.36 | 37.35 | 37.34 | | 150 day SMA | 36.32 | 36.33 | 36.34 | | 200 day SMA | 36.42 | 36.42 | 36.43 |
|
|
