VivopowerInternational VVPR full analysis,charts,indicators,moving averages,SMA,DMA,EMA,ADX,MACD,RSIVivopower International VVPR WideScreen charts, DMA,SMA,EMA technical analysis, forecast prediction, by indicators ADX,MACD,RSI,CCI USA stock exchange
operates under Public Utilities sector & deals in Power Generation
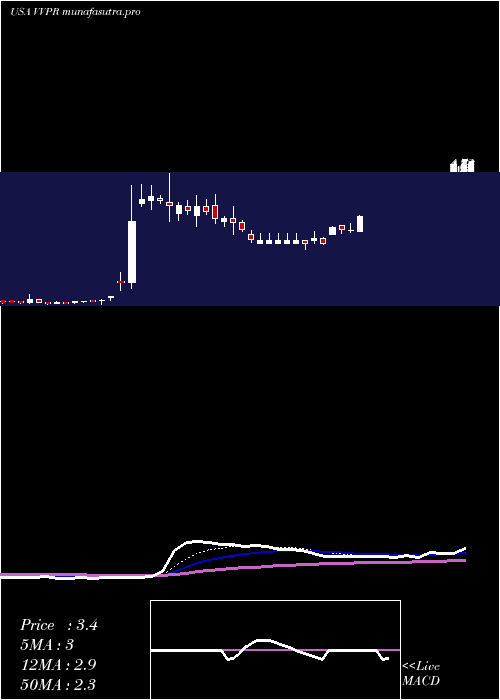
Daily price and charts and targets VivopowerInternational Strong Daily Stock price targets for VivopowerInternational VVPR are 2.59 and 2.75 | Daily Target 1 | 2.45 | | Daily Target 2 | 2.56 | | Daily Target 3 | 2.6133333333333 | | Daily Target 4 | 2.72 | | Daily Target 5 | 2.77 |
Daily price and volume Vivopower International
| Date |
Closing |
Open |
Range |
Volume |
Thu 04 December 2025 |
2.66 (1.14%) |
2.60 |
2.51 - 2.67 |
0.4727 times |
Wed 03 December 2025 |
2.63 (4.78%) |
2.55 |
2.44 - 2.66 |
0.5799 times |
Tue 02 December 2025 |
2.51 (6.36%) |
2.41 |
2.41 - 2.59 |
0.8408 times |
Mon 01 December 2025 |
2.36 (-10.27%) |
2.50 |
2.35 - 2.51 |
0.6926 times |
Fri 28 November 2025 |
2.63 (3.54%) |
2.59 |
2.57 - 2.79 |
0.4881 times |
Wed 26 November 2025 |
2.54 (3.67%) |
2.50 |
2.45 - 2.64 |
0.7547 times |
Tue 25 November 2025 |
2.45 (0.82%) |
2.37 |
2.32 - 2.57 |
1.2557 times |
Mon 24 November 2025 |
2.43 (7.52%) |
2.27 |
2.25 - 2.50 |
1.6161 times |
Fri 21 November 2025 |
2.26 (8.65%) |
2.12 |
2.07 - 2.30 |
1.1296 times |
Thu 20 November 2025 |
2.08 (-9.17%) |
2.30 |
2.05 - 2.43 |
2.1698 times |
Wed 19 November 2025 |
2.29 (-11.24%) |
2.58 |
2.25 - 2.64 |
1.4409 times |
Weekly price and charts VivopowerInternational Strong weekly Stock price targets for VivopowerInternational VVPR are 2.51 and 2.83 | Weekly Target 1 | 2.24 | | Weekly Target 2 | 2.45 | | Weekly Target 3 | 2.56 | | Weekly Target 4 | 2.77 | | Weekly Target 5 | 2.88 |
Weekly price and volumes for Vivopower International
| Date |
Closing |
Open |
Range |
Volume |
Thu 04 December 2025 |
2.66 (1.14%) |
2.50 |
2.35 - 2.67 |
0.352 times |
Fri 28 November 2025 |
2.63 (16.37%) |
2.27 |
2.25 - 2.79 |
0.5601 times |
Fri 21 November 2025 |
2.26 (-26.62%) |
3.04 |
2.05 - 3.09 |
1.2824 times |
Fri 14 November 2025 |
3.08 (-3.75%) |
3.38 |
3.02 - 3.64 |
0.8471 times |
Fri 07 November 2025 |
3.20 (8.47%) |
3.30 |
2.96 - 3.51 |
1.0191 times |
Fri 31 October 2025 |
2.95 (0%) |
4.55 |
2.75 - 4.60 |
0.9941 times |
Fri 31 October 2025 |
2.95 (-40.04%) |
5.11 |
2.75 - 5.12 |
1.4015 times |
Fri 24 October 2025 |
4.92 (12.59%) |
4.48 |
4.15 - 5.26 |
1.1628 times |
Fri 17 October 2025 |
4.37 (-6.42%) |
4.68 |
3.98 - 4.90 |
1.203 times |
Fri 10 October 2025 |
4.67 (-14.47%) |
5.52 |
4.60 - 5.67 |
1.1779 times |
Fri 03 October 2025 |
5.46 (16.67%) |
4.77 |
4.48 - 5.85 |
1.7838 times |
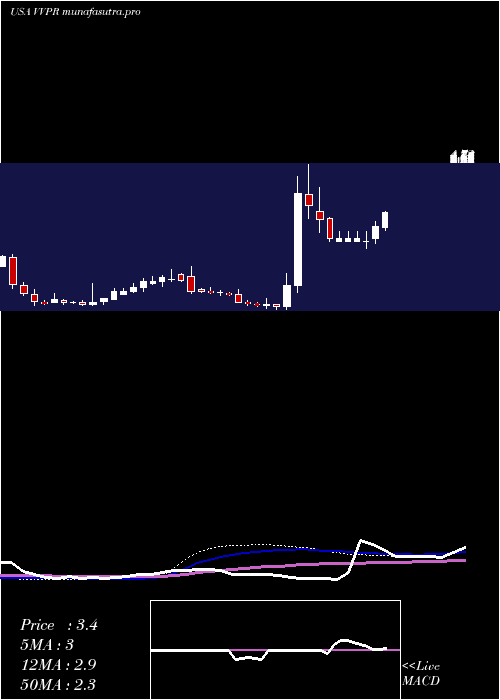
Monthly price and charts VivopowerInternational Strong monthly Stock price targets for VivopowerInternational VVPR are 2.51 and 2.83 | Monthly Target 1 | 2.24 | | Monthly Target 2 | 2.45 | | Monthly Target 3 | 2.56 | | Monthly Target 4 | 2.77 | | Monthly Target 5 | 2.88 |
Monthly price and volumes Vivopower International
| Date |
Closing |
Open |
Range |
Volume |
Thu 04 December 2025 |
2.66 (1.14%) |
2.50 |
2.35 - 2.67 |
0.0238 times |
Fri 28 November 2025 |
2.63 (-10.85%) |
3.30 |
2.05 - 3.64 |
0.2509 times |
Fri 31 October 2025 |
2.95 (-34.44%) |
4.52 |
2.75 - 5.85 |
0.5024 times |
Tue 30 September 2025 |
4.50 (-12.79%) |
5.11 |
4.40 - 5.50 |
0.359 times |
Fri 29 August 2025 |
5.16 (22.27%) |
4.06 |
3.60 - 6.98 |
1.1922 times |
Thu 31 July 2025 |
4.22 (3.69%) |
4.01 |
3.81 - 8.63 |
1.1598 times |
Mon 30 June 2025 |
4.07 (-12.28%) |
4.58 |
3.57 - 7.40 |
0.6407 times |
Fri 30 May 2025 |
4.64 (31.82%) |
3.54 |
3.20 - 8.88 |
0.9252 times |
Wed 30 April 2025 |
3.52 (-12%) |
3.96 |
2.35 - 4.74 |
0.5832 times |
Mon 31 March 2025 |
4.00 (433.33%) |
0.73 |
0.62 - 4.40 |
4.3628 times |
Fri 28 February 2025 |
0.75 (-31.19%) |
1.08 |
0.70 - 1.19 |
0.0702 times |

DMA SMA EMA moving averages of Vivopower International VVPR
DMA (daily moving average) of Vivopower International VVPR
| DMA period | DMA value | | 5 day DMA | 2.56 | | 12 day DMA | 2.45 | | 20 day DMA | 2.73 | | 35 day DMA | 3.34 | | 50 day DMA | 3.83 | | 100 day DMA | 4.54 | | 150 day DMA | 4.65 | | 200 day DMA | 4 | EMA (exponential moving average) of Vivopower International VVPR
| EMA period | EMA current | EMA prev | EMA prev2 | | 5 day EMA | 2.57 | 2.53 | 2.48 | | 12 day EMA | 2.61 | 2.6 | 2.59 | | 20 day EMA | 2.81 | 2.83 | 2.85 | | 35 day EMA | 3.27 | 3.31 | 3.35 | | 50 day EMA | 3.78 | 3.83 | 3.88 |
SMA (simple moving average) of Vivopower International VVPR
| SMA period | SMA current | SMA prev | SMA prev2 | | 5 day SMA | 2.56 | 2.53 | 2.5 | | 12 day SMA | 2.45 | 2.44 | 2.48 | | 20 day SMA | 2.73 | 2.75 | 2.78 | | 35 day SMA | 3.34 | 3.39 | 3.45 | | 50 day SMA | 3.83 | 3.87 | 3.92 | | 100 day SMA | 4.54 | 4.57 | 4.6 | | 150 day SMA | 4.65 | 4.65 | 4.66 | | 200 day SMA | 4 | 3.99 | 3.98 |
|
|
