VanguardRussell VTWO full analysis,charts,indicators,moving averages,SMA,DMA,EMA,ADX,MACD,RSIVanguard Russell VTWO WideScreen charts, DMA,SMA,EMA technical analysis, forecast prediction, by indicators ADX,MACD,RSI,CCI USA stock exchange
operates under N A sector & deals in N A
Daily price and charts and targets VanguardRussell Strong Daily Stock price targets for VanguardRussell VTWO are 99.61 and 101.06 | Daily Target 1 | 98.41 | | Daily Target 2 | 99.35 | | Daily Target 3 | 99.86 | | Daily Target 4 | 100.8 | | Daily Target 5 | 101.31 |
Daily price and volume Vanguard Russell
| Date |
Closing |
Open |
Range |
Volume |
Mon 20 October 2025 |
100.29 (1.92%) |
99.10 |
98.92 - 100.37 |
0.4834 times |
Fri 17 October 2025 |
98.40 (-0.32%) |
98.30 |
97.61 - 99.09 |
1.0753 times |
Thu 16 October 2025 |
98.72 (-2.46%) |
101.53 |
98.65 - 101.81 |
1.1259 times |
Wed 15 October 2025 |
101.21 (1.01%) |
101.21 |
99.87 - 102.16 |
0.8814 times |
Tue 14 October 2025 |
100.20 (1.44%) |
97.52 |
97.18 - 100.89 |
1.095 times |
Mon 13 October 2025 |
98.78 (2.76%) |
97.76 |
97.60 - 98.88 |
1.4671 times |
Fri 10 October 2025 |
96.13 (-2.98%) |
99.36 |
96.05 - 99.77 |
2.3328 times |
Thu 09 October 2025 |
99.08 (-0.6%) |
99.55 |
98.64 - 99.93 |
0.4569 times |
Wed 08 October 2025 |
99.68 (0.99%) |
99.15 |
98.56 - 99.82 |
0.4628 times |
Tue 07 October 2025 |
98.70 (-0.89%) |
99.99 |
98.32 - 100.09 |
0.6194 times |
Mon 06 October 2025 |
99.59 (0.22%) |
99.60 |
99.46 - 100.43 |
0.4193 times |
Weekly price and charts VanguardRussell Strong weekly Stock price targets for VanguardRussell VTWO are 99.61 and 101.06 | Weekly Target 1 | 98.41 | | Weekly Target 2 | 99.35 | | Weekly Target 3 | 99.86 | | Weekly Target 4 | 100.8 | | Weekly Target 5 | 101.31 |
Weekly price and volumes for Vanguard Russell
| Date |
Closing |
Open |
Range |
Volume |
Mon 20 October 2025 |
100.29 (1.92%) |
99.10 |
98.92 - 100.37 |
0.183 times |
Fri 17 October 2025 |
98.40 (2.36%) |
97.76 |
97.18 - 102.16 |
2.1368 times |
Fri 10 October 2025 |
96.13 (-3.26%) |
99.60 |
96.05 - 100.43 |
1.6244 times |
Fri 03 October 2025 |
99.37 (1.84%) |
98.18 |
96.78 - 100.27 |
1.0658 times |
Fri 26 September 2025 |
97.57 (-0.99%) |
98.26 |
96.02 - 100.27 |
0.9183 times |
Fri 19 September 2025 |
98.55 (2.22%) |
96.76 |
96.05 - 99.57 |
1.2012 times |
Fri 12 September 2025 |
96.41 (0.28%) |
96.45 |
95.23 - 97.43 |
1.0684 times |
Fri 05 September 2025 |
96.14 (1.06%) |
93.84 |
93.64 - 96.94 |
0.7984 times |
Fri 29 August 2025 |
95.13 (0%) |
95.74 |
94.82 - 95.84 |
0.1507 times |
Fri 29 August 2025 |
95.13 (0.17%) |
94.70 |
93.98 - 95.84 |
0.8531 times |
Fri 22 August 2025 |
94.97 (3.4%) |
91.90 |
90.47 - 95.21 |
1.5001 times |
Monthly price and charts VanguardRussell Strong monthly Stock price targets for VanguardRussell VTWO are 98.17 and 104.28 | Monthly Target 1 | 93.39 | | Monthly Target 2 | 96.84 | | Monthly Target 3 | 99.5 | | Monthly Target 4 | 102.95 | | Monthly Target 5 | 105.61 |
Monthly price and volumes Vanguard Russell
| Date |
Closing |
Open |
Range |
Volume |
Mon 20 October 2025 |
100.29 (2.53%) |
97.25 |
96.05 - 102.16 |
1.1271 times |
Tue 30 September 2025 |
97.82 (2.83%) |
93.84 |
93.64 - 100.27 |
1.0927 times |
Fri 29 August 2025 |
95.13 (7.21%) |
87.42 |
85.88 - 95.84 |
1.0911 times |
Thu 31 July 2025 |
88.73 (1.73%) |
86.74 |
86.58 - 91.68 |
1.4192 times |
Mon 30 June 2025 |
87.22 (5.1%) |
82.99 |
81.94 - 87.82 |
0.7509 times |
Fri 30 May 2025 |
82.99 (5.38%) |
79.03 |
78.32 - 84.92 |
0.6611 times |
Wed 30 April 2025 |
78.75 (-2.36%) |
80.42 |
69.38 - 82.18 |
1.5064 times |
Mon 31 March 2025 |
80.65 (-7.1%) |
87.10 |
78.99 - 87.32 |
0.7617 times |
Fri 28 February 2025 |
86.81 (-5.23%) |
89.52 |
85.34 - 93.29 |
0.6068 times |
Fri 31 January 2025 |
91.60 (2.54%) |
90.02 |
86.52 - 93.13 |
0.9831 times |
Tue 31 December 2024 |
89.33 (-8.24%) |
97.34 |
88.10 - 97.65 |
0.5846 times |

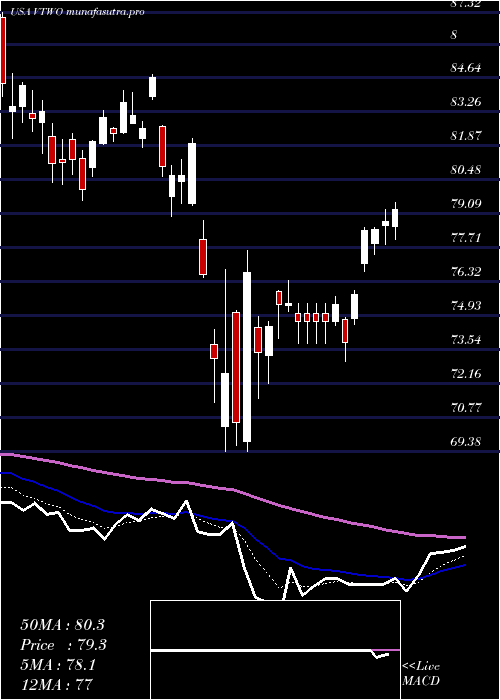
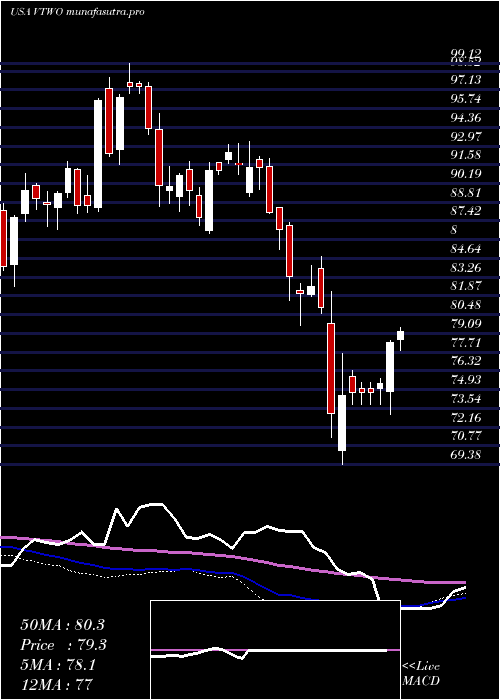
DMA SMA EMA moving averages of Vanguard Russell VTWO
DMA (daily moving average) of Vanguard Russell VTWO
| DMA period | DMA value | | 5 day DMA | 99.76 | | 12 day DMA | 99.18 | | 20 day DMA | 98.66 | | 35 day DMA | 97.8 | | 50 day DMA | 96.47 | | 100 day DMA | 92.07 | | 150 day DMA | 87.87 | | 200 day DMA | 88.16 | EMA (exponential moving average) of Vanguard Russell VTWO
| EMA period | EMA current | EMA prev | EMA prev2 | | 5 day EMA | 99.46 | 99.05 | 99.37 | | 12 day EMA | 99.09 | 98.87 | 98.96 | | 20 day EMA | 98.61 | 98.43 | 98.43 | | 35 day EMA | 97.35 | 97.18 | 97.11 | | 50 day EMA | 96.2 | 96.03 | 95.93 |
SMA (simple moving average) of Vanguard Russell VTWO
| SMA period | SMA current | SMA prev | SMA prev2 | | 5 day SMA | 99.76 | 99.46 | 99.01 | | 12 day SMA | 99.18 | 99.04 | 99.01 | | 20 day SMA | 98.66 | 98.6 | 98.61 | | 35 day SMA | 97.8 | 97.66 | 97.56 | | 50 day SMA | 96.47 | 96.25 | 96.06 | | 100 day SMA | 92.07 | 91.91 | 91.74 | | 150 day SMA | 87.87 | 87.74 | 87.62 | | 200 day SMA | 88.16 | 88.11 | 88.06 |
|
|
