VanguardRussell VTWG full analysis,charts,indicators,moving averages,SMA,DMA,EMA,ADX,MACD,RSIVanguard Russell VTWG WideScreen charts, DMA,SMA,EMA technical analysis, forecast prediction, by indicators ADX,MACD,RSI,CCI USA stock exchange
operates under N A sector & deals in N A
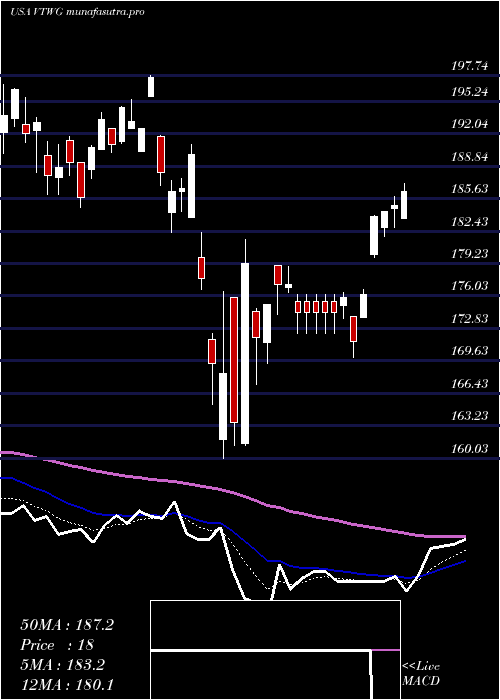
Daily price and charts and targets VanguardRussell Strong Daily Stock price targets for VanguardRussell VTWG are 240.33 and 242.68 | Daily Target 1 | 239.87 | | Daily Target 2 | 240.79 | | Daily Target 3 | 242.21666666667 | | Daily Target 4 | 243.14 | | Daily Target 5 | 244.57 |
Daily price and volume Vanguard Russell
| Date |
Closing |
Open |
Range |
Volume |
Fri 05 December 2025 |
241.72 (-0.59%) |
243.33 |
241.29 - 243.64 |
1.4409 times |
Thu 04 December 2025 |
243.16 (1.34%) |
239.60 |
239.23 - 244.00 |
1.4595 times |
Wed 03 December 2025 |
239.95 (1.89%) |
236.25 |
235.69 - 240.03 |
0.7854 times |
Tue 02 December 2025 |
235.51 (0.03%) |
237.02 |
235.51 - 238.24 |
0.5999 times |
Mon 01 December 2025 |
235.45 (-1.79%) |
236.64 |
235.32 - 237.75 |
0.538 times |
Fri 28 November 2025 |
239.73 (0.77%) |
239.30 |
238.37 - 239.73 |
0.2845 times |
Wed 26 November 2025 |
237.90 (0.95%) |
236.49 |
235.95 - 239.44 |
1.0946 times |
Tue 25 November 2025 |
235.67 (1.94%) |
231.15 |
230.87 - 235.78 |
1.1132 times |
Mon 24 November 2025 |
231.19 (2.63%) |
225.61 |
225.61 - 231.41 |
1.6203 times |
Fri 21 November 2025 |
225.27 (2.57%) |
220.49 |
219.19 - 226.74 |
1.0637 times |
Thu 20 November 2025 |
219.62 (-2.35%) |
229.38 |
219.58 - 229.50 |
0.6555 times |
Weekly price and charts VanguardRussell Strong weekly Stock price targets for VanguardRussell VTWG are 238.52 and 247.2 | Weekly Target 1 | 231.67 | | Weekly Target 2 | 236.69 | | Weekly Target 3 | 240.34666666667 | | Weekly Target 4 | 245.37 | | Weekly Target 5 | 249.03 |
Weekly price and volumes for Vanguard Russell
| Date |
Closing |
Open |
Range |
Volume |
Fri 05 December 2025 |
241.72 (0.83%) |
236.64 |
235.32 - 244.00 |
1.1417 times |
Fri 28 November 2025 |
239.73 (6.42%) |
225.61 |
225.61 - 239.73 |
0.9734 times |
Fri 21 November 2025 |
225.27 (-1.12%) |
226.46 |
219.19 - 229.50 |
1.1622 times |
Fri 14 November 2025 |
227.83 (-2.76%) |
238.57 |
222.38 - 238.57 |
0.7289 times |
Fri 07 November 2025 |
234.30 (-2.95%) |
235.03 |
228.51 - 240.00 |
1.0187 times |
Fri 31 October 2025 |
241.41 (0%) |
240.25 |
238.80 - 241.94 |
0.2722 times |
Fri 31 October 2025 |
241.41 (-0.34%) |
244.79 |
238.80 - 244.99 |
0.8826 times |
Fri 24 October 2025 |
242.24 (2.29%) |
239.83 |
232.21 - 243.59 |
1.433 times |
Fri 17 October 2025 |
236.81 (2.25%) |
235.75 |
234.77 - 246.00 |
1.3481 times |
Fri 10 October 2025 |
231.60 (-2.6%) |
240.46 |
231.60 - 240.61 |
1.0392 times |
Fri 03 October 2025 |
237.79 (2.04%) |
235.45 |
231.27 - 240.00 |
2.4001 times |
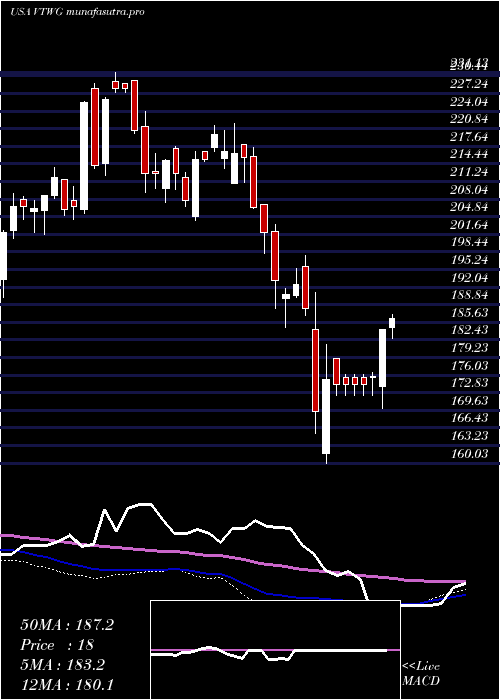
Monthly price and charts VanguardRussell Strong monthly Stock price targets for VanguardRussell VTWG are 238.52 and 247.2 | Monthly Target 1 | 231.67 | | Monthly Target 2 | 236.69 | | Monthly Target 3 | 240.34666666667 | | Monthly Target 4 | 245.37 | | Monthly Target 5 | 249.03 |
Monthly price and volumes Vanguard Russell
| Date |
Closing |
Open |
Range |
Volume |
Fri 05 December 2025 |
241.72 (0.83%) |
236.64 |
235.32 - 244.00 |
0.1969 times |
Fri 28 November 2025 |
239.73 (-0.7%) |
235.03 |
219.19 - 240.00 |
0.6696 times |
Fri 31 October 2025 |
241.41 (3.26%) |
232.18 |
231.60 - 246.00 |
1.2041 times |
Tue 30 September 2025 |
233.78 (4.04%) |
221.20 |
220.96 - 239.57 |
0.8561 times |
Fri 29 August 2025 |
224.70 (6.04%) |
208.11 |
205.16 - 226.97 |
1.0601 times |
Thu 31 July 2025 |
211.90 (1.65%) |
207.26 |
206.66 - 216.86 |
0.7425 times |
Mon 30 June 2025 |
208.47 (5.69%) |
197.87 |
195.00 - 209.91 |
0.5601 times |
Fri 30 May 2025 |
197.24 (6.68%) |
186.62 |
186.30 - 201.35 |
0.7022 times |
Wed 30 April 2025 |
184.89 (-0.79%) |
186.30 |
160.03 - 190.96 |
2.3299 times |
Mon 31 March 2025 |
186.36 (-7.74%) |
202.19 |
182.28 - 203.49 |
1.6786 times |
Fri 28 February 2025 |
202.00 (-6.74%) |
210.92 |
198.05 - 221.71 |
1.3776 times |

DMA SMA EMA moving averages of Vanguard Russell VTWG
DMA (daily moving average) of Vanguard Russell VTWG
| DMA period | DMA value | | 5 day DMA | 239.16 | | 12 day DMA | 234.17 | | 20 day DMA | 232.85 | | 35 day DMA | 235.66 | | 50 day DMA | 236.13 | | 100 day DMA | 228.92 | | 150 day DMA | 220.07 | | 200 day DMA | 211.68 | EMA (exponential moving average) of Vanguard Russell VTWG
| EMA period | EMA current | EMA prev | EMA prev2 | | 5 day EMA | 239.85 | 238.92 | 236.8 | | 12 day EMA | 236.59 | 235.66 | 234.3 | | 20 day EMA | 235.45 | 234.79 | 233.91 | | 35 day EMA | 235.2 | 234.82 | 234.33 | | 50 day EMA | 236.36 | 236.14 | 235.85 |
SMA (simple moving average) of Vanguard Russell VTWG
| SMA period | SMA current | SMA prev | SMA prev2 | | 5 day SMA | 239.16 | 238.76 | 237.71 | | 12 day SMA | 234.17 | 232.73 | 231.13 | | 20 day SMA | 232.85 | 232.44 | 232.22 | | 35 day SMA | 235.66 | 235.59 | 235.62 | | 50 day SMA | 236.13 | 235.91 | 235.71 | | 100 day SMA | 228.92 | 228.62 | 228.29 | | 150 day SMA | 220.07 | 219.7 | 219.31 | | 200 day SMA | 211.68 | 211.56 | 211.43 |
|
|
