VtvTherapeutics VTVT full analysis,charts,indicators,moving averages,SMA,DMA,EMA,ADX,MACD,RSIVtv Therapeutics VTVT WideScreen charts, DMA,SMA,EMA technical analysis, forecast prediction, by indicators ADX,MACD,RSI,CCI USA stock exchange
operates under Health Care sector & deals in Major Pharmaceuticals
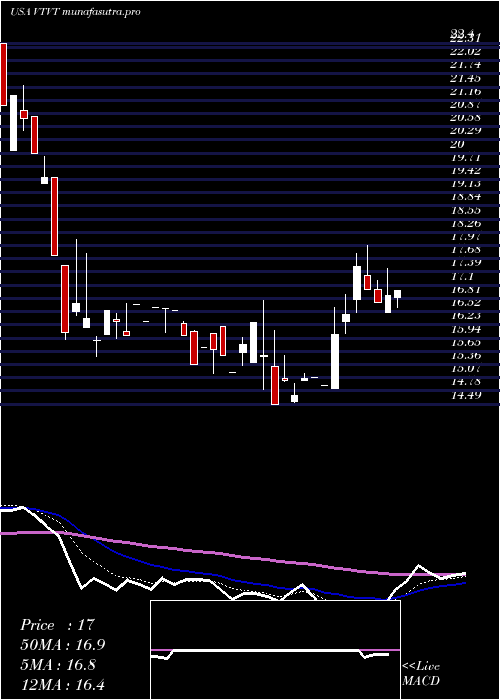
Daily price and charts and targets VtvTherapeutics Strong Daily Stock price targets for VtvTherapeutics VTVT are 20.58 and 20.64 | Daily Target 1 | 20.53 | | Daily Target 2 | 20.57 | | Daily Target 3 | 20.59 | | Daily Target 4 | 20.63 | | Daily Target 5 | 20.65 |
Daily price and volume Vtv Therapeutics
| Date |
Closing |
Open |
Range |
Volume |
Mon 20 October 2025 |
20.61 (1.88%) |
20.55 |
20.55 - 20.61 |
0.1411 times |
Fri 17 October 2025 |
20.23 (-2.69%) |
20.20 |
20.20 - 20.23 |
0.7056 times |
Thu 16 October 2025 |
20.79 (-7.23%) |
19.80 |
19.80 - 21.20 |
0.6855 times |
Wed 15 October 2025 |
22.41 (2.75%) |
21.94 |
21.57 - 22.41 |
0.2218 times |
Tue 14 October 2025 |
21.81 (0%) |
21.80 |
21.80 - 21.81 |
0.3226 times |
Mon 13 October 2025 |
21.81 (-0.23%) |
22.50 |
20.25 - 22.50 |
0.3427 times |
Fri 10 October 2025 |
21.86 (-4.5%) |
21.86 |
21.86 - 21.86 |
0.2218 times |
Thu 09 October 2025 |
22.89 (3.48%) |
20.89 |
20.89 - 23.05 |
2.0766 times |
Wed 08 October 2025 |
22.12 (-1.91%) |
22.53 |
21.00 - 22.66 |
5.0202 times |
Tue 07 October 2025 |
22.55 (-0.18%) |
22.47 |
22.47 - 22.57 |
0.2621 times |
Mon 06 October 2025 |
22.59 (-6.27%) |
23.27 |
22.42 - 23.74 |
1.754 times |
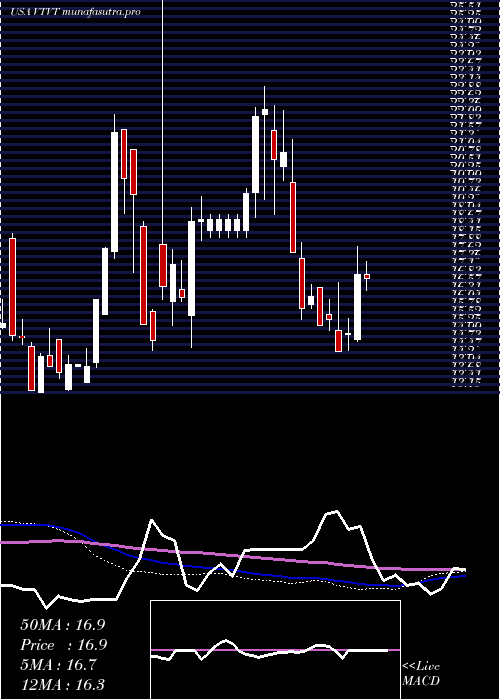
Weekly price and charts VtvTherapeutics Strong weekly Stock price targets for VtvTherapeutics VTVT are 20.58 and 20.64 | Weekly Target 1 | 20.53 | | Weekly Target 2 | 20.57 | | Weekly Target 3 | 20.59 | | Weekly Target 4 | 20.63 | | Weekly Target 5 | 20.65 |
Weekly price and volumes for Vtv Therapeutics
| Date |
Closing |
Open |
Range |
Volume |
Mon 20 October 2025 |
20.61 (1.88%) |
20.55 |
20.55 - 20.61 |
0.0369 times |
Fri 17 October 2025 |
20.23 (-7.46%) |
22.50 |
19.80 - 22.50 |
0.5963 times |
Fri 10 October 2025 |
21.86 (-9.29%) |
23.27 |
20.89 - 23.74 |
2.4431 times |
Fri 03 October 2025 |
24.10 (7.93%) |
22.29 |
21.08 - 24.46 |
0.7342 times |
Fri 26 September 2025 |
22.33 (-0.22%) |
21.70 |
20.25 - 23.47 |
0.9973 times |
Fri 19 September 2025 |
22.38 (13.26%) |
21.40 |
18.97 - 23.50 |
2.1476 times |
Fri 12 September 2025 |
19.76 (7.92%) |
18.94 |
18.76 - 21.01 |
0.9973 times |
Fri 05 September 2025 |
18.31 (12.75%) |
17.05 |
17.00 - 19.43 |
1.5777 times |
Wed 27 August 2025 |
16.24 (1.5%) |
15.79 |
15.79 - 16.99 |
0.2058 times |
Fri 22 August 2025 |
16.00 (3.63%) |
15.05 |
14.55 - 16.00 |
0.2638 times |
Fri 15 August 2025 |
15.44 (10.29%) |
14.75 |
14.00 - 16.01 |
0.5752 times |
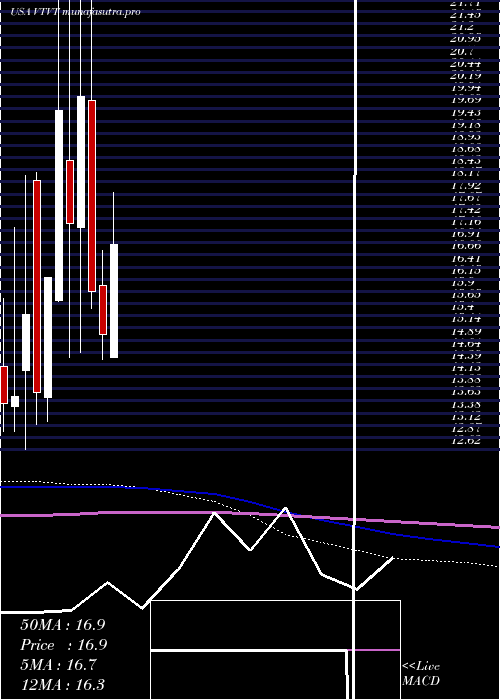
Monthly price and charts VtvTherapeutics Strong monthly Stock price targets for VtvTherapeutics VTVT are 17.88 and 22.54 | Monthly Target 1 | 16.96 | | Monthly Target 2 | 18.79 | | Monthly Target 3 | 21.623333333333 | | Monthly Target 4 | 23.45 | | Monthly Target 5 | 26.28 |
Monthly price and volumes Vtv Therapeutics
| Date |
Closing |
Open |
Range |
Volume |
Mon 20 October 2025 |
20.61 (-11.73%) |
22.58 |
19.80 - 24.46 |
0.2951 times |
Tue 30 September 2025 |
23.35 (43.78%) |
17.05 |
17.00 - 23.81 |
0.5575 times |
Wed 27 August 2025 |
16.24 (8.63%) |
14.55 |
14.00 - 16.99 |
0.1133 times |
Wed 30 July 2025 |
14.95 (-0.33%) |
14.54 |
14.53 - 17.96 |
0.2993 times |
Mon 30 June 2025 |
15.00 (-5.6%) |
16.02 |
14.49 - 16.76 |
0.7327 times |
Fri 30 May 2025 |
15.89 (-20.35%) |
19.87 |
15.54 - 22.58 |
0.5632 times |
Wed 30 April 2025 |
19.95 (15.18%) |
17.23 |
14.63 - 23.20 |
1.1912 times |
Mon 31 March 2025 |
17.32 (-11.9%) |
18.61 |
14.53 - 26.99 |
4.4511 times |
Fri 28 February 2025 |
19.66 (21.43%) |
15.72 |
15.70 - 22.30 |
0.99 times |
Fri 31 January 2025 |
16.19 (17.23%) |
13.71 |
13.20 - 16.19 |
0.8066 times |
Tue 31 December 2024 |
13.81 (-10.44%) |
18.21 |
13.15 - 18.37 |
1.2271 times |
DMA SMA EMA moving averages of Vtv Therapeutics VTVT
DMA (daily moving average) of Vtv Therapeutics VTVT
| DMA period | DMA value | | 5 day DMA | 21.17 | | 12 day DMA | 21.98 | | 20 day DMA | 22.33 | | 35 day DMA | 21.3 | | 50 day DMA | 19.42 | | 100 day DMA | 18.17 | | 150 day DMA | 18.3 | | 200 day DMA | 17.72 | EMA (exponential moving average) of Vtv Therapeutics VTVT
| EMA period | EMA current | EMA prev | EMA prev2 | | 5 day EMA | 21.02 | 21.23 | 21.73 | | 12 day EMA | 21.62 | 21.8 | 22.08 | | 20 day EMA | 21.56 | 21.66 | 21.81 | | 35 day EMA | 20.55 | 20.55 | 20.57 | | 50 day EMA | 19.29 | 19.24 | 19.2 |
SMA (simple moving average) of Vtv Therapeutics VTVT
| SMA period | SMA current | SMA prev | SMA prev2 | | 5 day SMA | 21.17 | 21.41 | 21.74 | | 12 day SMA | 21.98 | 22.19 | 22.51 | | 20 day SMA | 22.33 | 22.4 | 22.51 | | 35 day SMA | 21.3 | 21.18 | 21.05 | | 50 day SMA | 19.42 | 19.31 | 19.21 | | 100 day SMA | 18.17 | 18.17 | 18.17 | | 150 day SMA | 18.3 | 18.29 | 18.28 | | 200 day SMA | 17.72 | 17.69 | 17.67 |
|
|
