VirtraInc VTSI full analysis,charts,indicators,moving averages,SMA,DMA,EMA,ADX,MACD,RSIVirtra Inc VTSI WideScreen charts, DMA,SMA,EMA technical analysis, forecast prediction, by indicators ADX,MACD,RSI,CCI USA stock exchange
operates under Consumer Services sector & deals in Services Misc Amusement Recreation
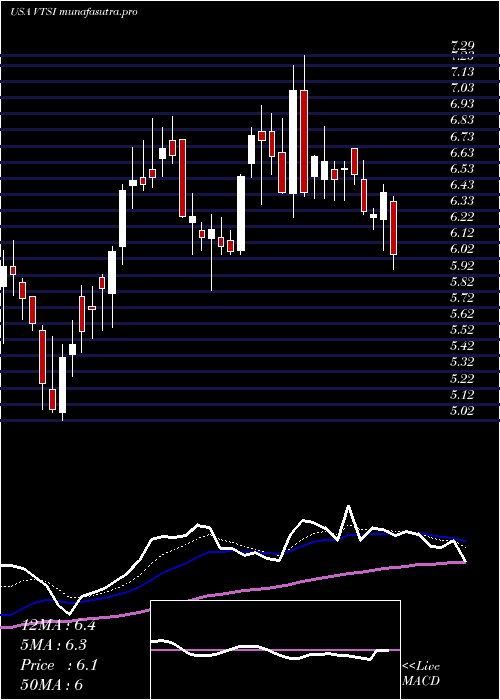
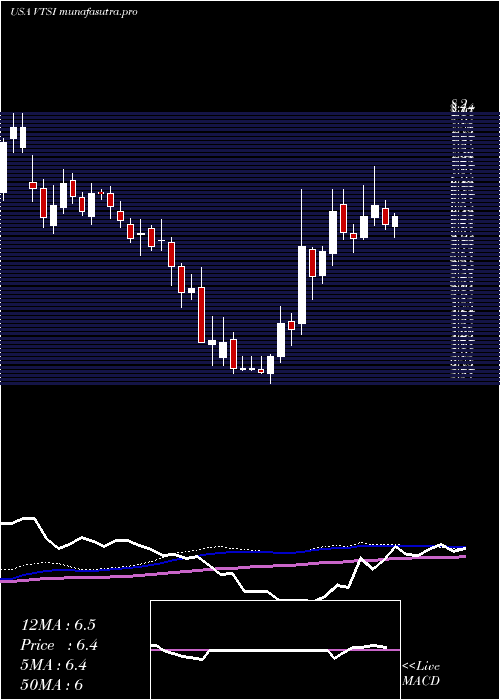
Daily price and charts and targets VirtraInc Strong Daily Stock price targets for VirtraInc VTSI are 4.92 and 5.04 | Daily Target 1 | 4.9 | | Daily Target 2 | 4.94 | | Daily Target 3 | 5.0166666666667 | | Daily Target 4 | 5.06 | | Daily Target 5 | 5.14 |
Daily price and volume Virtra Inc
| Date |
Closing |
Open |
Range |
Volume |
Thu 04 December 2025 |
4.99 (-2.16%) |
5.05 |
4.97 - 5.09 |
0.9357 times |
Wed 03 December 2025 |
5.10 (3.03%) |
4.95 |
4.95 - 5.10 |
0.7247 times |
Tue 02 December 2025 |
4.95 (-0.8%) |
5.06 |
4.95 - 5.13 |
1.7225 times |
Mon 01 December 2025 |
4.99 (0.6%) |
4.95 |
4.95 - 5.06 |
1.2534 times |
Fri 28 November 2025 |
4.96 (1.22%) |
4.94 |
4.94 - 5.00 |
0.4294 times |
Wed 26 November 2025 |
4.90 (0.62%) |
4.84 |
4.84 - 4.99 |
0.5311 times |
Tue 25 November 2025 |
4.87 (0%) |
4.86 |
4.79 - 4.95 |
1.5041 times |
Mon 24 November 2025 |
4.87 (1.25%) |
4.85 |
4.80 - 5.04 |
1.1938 times |
Fri 21 November 2025 |
4.81 (1.69%) |
4.67 |
4.65 - 4.93 |
0.5262 times |
Thu 20 November 2025 |
4.73 (-3.47%) |
4.99 |
4.72 - 5.11 |
1.179 times |
Wed 19 November 2025 |
4.90 (2.73%) |
4.89 |
4.80 - 5.02 |
1.0598 times |
Weekly price and charts VirtraInc Strong weekly Stock price targets for VirtraInc VTSI are 4.97 and 5.15 | Weekly Target 1 | 4.84 | | Weekly Target 2 | 4.92 | | Weekly Target 3 | 5.0233333333333 | | Weekly Target 4 | 5.1 | | Weekly Target 5 | 5.2 |
Weekly price and volumes for Virtra Inc
| Date |
Closing |
Open |
Range |
Volume |
Thu 04 December 2025 |
4.99 (0.6%) |
4.95 |
4.95 - 5.13 |
0.9114 times |
Fri 28 November 2025 |
4.96 (3.12%) |
4.85 |
4.79 - 5.04 |
0.7192 times |
Fri 21 November 2025 |
4.81 (-0.82%) |
4.93 |
4.65 - 5.44 |
1.19 times |
Fri 14 November 2025 |
4.85 (-10.02%) |
5.48 |
4.70 - 5.70 |
2.4962 times |
Fri 07 November 2025 |
5.39 (-11.35%) |
5.72 |
5.20 - 5.93 |
0.5513 times |
Fri 31 October 2025 |
6.08 (0%) |
5.90 |
5.85 - 6.08 |
0.0649 times |
Fri 31 October 2025 |
6.08 (-2.72%) |
6.29 |
5.80 - 6.29 |
0.5513 times |
Fri 24 October 2025 |
6.25 (10.62%) |
5.70 |
5.63 - 6.25 |
0.7035 times |
Fri 17 October 2025 |
5.65 (-3.09%) |
5.95 |
5.53 - 6.20 |
0.9538 times |
Fri 10 October 2025 |
5.83 (5.62%) |
5.65 |
5.53 - 6.25 |
1.8584 times |
Fri 03 October 2025 |
5.52 (2.6%) |
5.47 |
5.19 - 5.84 |
1.5378 times |
Monthly price and charts VirtraInc Strong monthly Stock price targets for VirtraInc VTSI are 4.97 and 5.15 | Monthly Target 1 | 4.84 | | Monthly Target 2 | 4.92 | | Monthly Target 3 | 5.0233333333333 | | Monthly Target 4 | 5.1 | | Monthly Target 5 | 5.2 |
Monthly price and volumes Virtra Inc
| Date |
Closing |
Open |
Range |
Volume |
Thu 04 December 2025 |
4.99 (0.6%) |
4.95 |
4.95 - 5.13 |
0.1214 times |
Fri 28 November 2025 |
4.96 (-18.42%) |
5.72 |
4.65 - 5.93 |
0.6603 times |
Fri 31 October 2025 |
6.08 (15.59%) |
5.27 |
5.22 - 6.29 |
0.6884 times |
Tue 30 September 2025 |
5.26 (-12.04%) |
5.94 |
5.19 - 6.06 |
0.522 times |
Fri 29 August 2025 |
5.98 (-15.66%) |
7.01 |
5.11 - 7.47 |
1.0999 times |
Thu 31 July 2025 |
7.09 (0.28%) |
7.07 |
5.81 - 7.29 |
1.1434 times |
Mon 30 June 2025 |
7.07 (21.06%) |
5.81 |
5.60 - 7.23 |
2.0374 times |
Fri 30 May 2025 |
5.84 (24.79%) |
4.72 |
4.23 - 6.91 |
1.5918 times |
Wed 30 April 2025 |
4.68 (14.99%) |
4.12 |
3.57 - 4.78 |
1.2813 times |
Mon 31 March 2025 |
4.07 (-32.39%) |
6.00 |
3.88 - 6.08 |
0.8541 times |
Fri 28 February 2025 |
6.02 (-5.49%) |
6.30 |
5.77 - 6.40 |
0.8373 times |
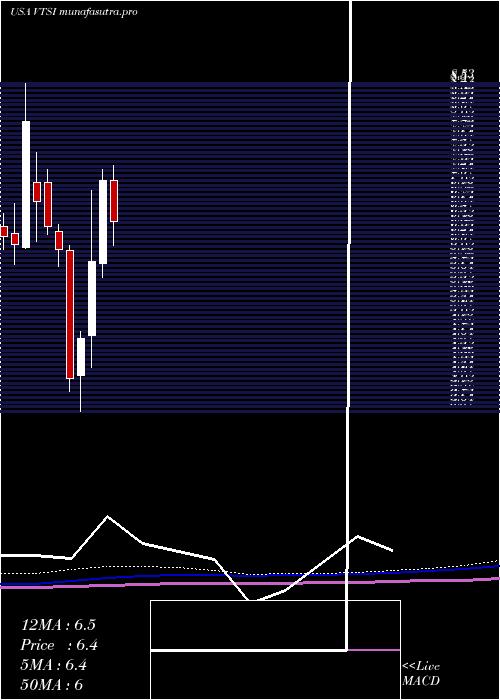
DMA SMA EMA moving averages of Virtra Inc VTSI
DMA (daily moving average) of Virtra Inc VTSI
| DMA period | DMA value | | 5 day DMA | 5 | | 12 day DMA | 4.9 | | 20 day DMA | 4.98 | | 35 day DMA | 5.37 | | 50 day DMA | 5.49 | | 100 day DMA | 5.73 | | 150 day DMA | 5.8 | | 200 day DMA | 5.57 | EMA (exponential moving average) of Virtra Inc VTSI
| EMA period | EMA current | EMA prev | EMA prev2 | | 5 day EMA | 4.99 | 4.99 | 4.94 | | 12 day EMA | 5 | 5 | 4.98 | | 20 day EMA | 5.08 | 5.09 | 5.09 | | 35 day EMA | 5.23 | 5.24 | 5.25 | | 50 day EMA | 5.45 | 5.47 | 5.48 |
SMA (simple moving average) of Virtra Inc VTSI
| SMA period | SMA current | SMA prev | SMA prev2 | | 5 day SMA | 5 | 4.98 | 4.93 | | 12 day SMA | 4.9 | 4.9 | 4.88 | | 20 day SMA | 4.98 | 5.01 | 5.03 | | 35 day SMA | 5.37 | 5.41 | 5.43 | | 50 day SMA | 5.49 | 5.5 | 5.51 | | 100 day SMA | 5.73 | 5.74 | 5.76 | | 150 day SMA | 5.8 | 5.8 | 5.8 | | 200 day SMA | 5.57 | 5.57 | 5.58 |
|
|
