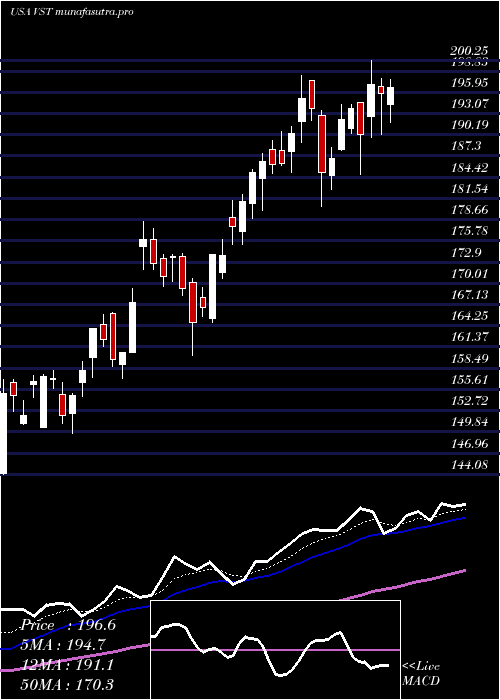
VistraEnergy VST full analysis,charts,indicators,moving averages,SMA,DMA,EMA,ADX,MACD,RSIVistra Energy VST WideScreen charts, DMA,SMA,EMA technical analysis, forecast prediction, by indicators ADX,MACD,RSI,CCI USA stock exchange
operates under Public Utilities sector & deals in Electric Utilities Central
Daily price and charts and targets VistraEnergy Strong Daily Stock price targets for VistraEnergy VST are 173.31 and 180.89 | Daily Target 1 | 167.31 | | Daily Target 2 | 171.72 | | Daily Target 3 | 174.88666666667 | | Daily Target 4 | 179.3 | | Daily Target 5 | 182.47 |
Daily price and volume Vistra Energy
| Date |
Closing |
Open |
Range |
Volume |
Thu 04 December 2025 |
176.14 (2.62%) |
172.41 |
170.47 - 178.05 |
0.5986 times |
Wed 03 December 2025 |
171.65 (-0.57%) |
172.66 |
168.95 - 173.85 |
0.8436 times |
Tue 02 December 2025 |
172.63 (-0.58%) |
174.79 |
171.37 - 175.95 |
0.5332 times |
Mon 01 December 2025 |
173.64 (-2.92%) |
176.01 |
172.69 - 176.48 |
1.1003 times |
Fri 28 November 2025 |
178.86 (1.11%) |
179.00 |
178.01 - 180.77 |
0.6459 times |
Wed 26 November 2025 |
176.89 (3.54%) |
172.00 |
171.60 - 177.75 |
0.4894 times |
Tue 25 November 2025 |
170.84 (-2.43%) |
174.08 |
165.90 - 174.73 |
1.308 times |
Mon 24 November 2025 |
175.09 (3.86%) |
169.50 |
165.90 - 175.20 |
0.9019 times |
Fri 21 November 2025 |
168.59 (-2.99%) |
172.00 |
162.44 - 173.68 |
2.1334 times |
Thu 20 November 2025 |
173.79 (-2.99%) |
184.82 |
173.13 - 189.29 |
1.4457 times |
Wed 19 November 2025 |
179.14 (2.71%) |
175.16 |
174.22 - 181.50 |
1.1454 times |
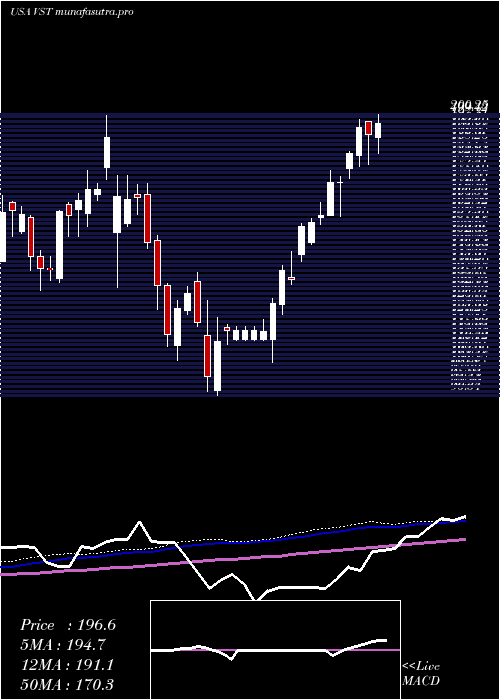
Weekly price and charts VistraEnergy Strong weekly Stock price targets for VistraEnergy VST are 172.55 and 181.65 | Weekly Target 1 | 165.28 | | Weekly Target 2 | 170.71 | | Weekly Target 3 | 174.38 | | Weekly Target 4 | 179.81 | | Weekly Target 5 | 183.48 |
Weekly price and volumes for Vistra Energy
| Date |
Closing |
Open |
Range |
Volume |
Thu 04 December 2025 |
176.14 (-1.52%) |
176.01 |
168.95 - 178.05 |
0.6196 times |
Fri 28 November 2025 |
178.86 (6.09%) |
169.50 |
165.90 - 180.77 |
0.6739 times |
Fri 21 November 2025 |
168.59 (-3.49%) |
175.43 |
162.44 - 189.29 |
1.286 times |
Fri 14 November 2025 |
174.69 (-8.54%) |
194.80 |
165.58 - 196.80 |
1.3488 times |
Fri 07 November 2025 |
191.01 (1.44%) |
188.01 |
176.60 - 192.48 |
0.97 times |
Fri 31 October 2025 |
188.30 (0%) |
192.00 |
183.52 - 192.89 |
0.2885 times |
Fri 31 October 2025 |
188.30 (-6.56%) |
203.66 |
183.52 - 203.66 |
1.9171 times |
Fri 24 October 2025 |
201.51 (0.08%) |
204.01 |
179.65 - 205.50 |
1.0561 times |
Fri 17 October 2025 |
201.35 (0.87%) |
201.12 |
200.05 - 217.10 |
1.3586 times |
Tue 07 October 2025 |
199.62 (-1.08%) |
203.26 |
195.89 - 207.93 |
0.4813 times |
Fri 03 October 2025 |
201.80 (-2.62%) |
202.00 |
190.70 - 210.20 |
1.7856 times |
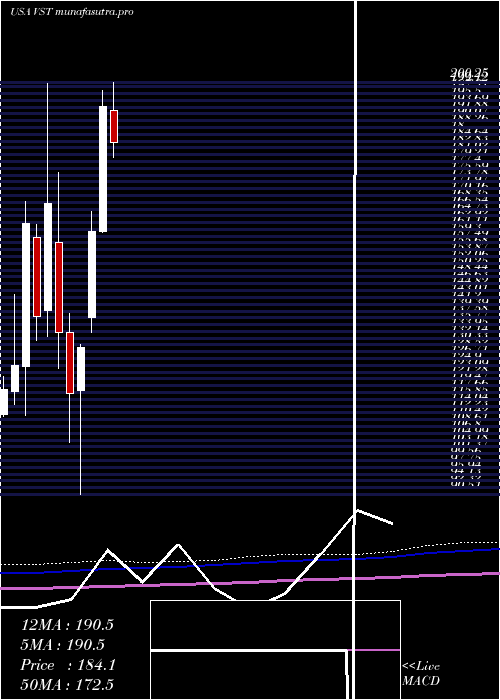
Monthly price and charts VistraEnergy Strong monthly Stock price targets for VistraEnergy VST are 172.55 and 181.65 | Monthly Target 1 | 165.28 | | Monthly Target 2 | 170.71 | | Monthly Target 3 | 174.38 | | Monthly Target 4 | 179.81 | | Monthly Target 5 | 183.48 |
Monthly price and volumes Vistra Energy
| Date |
Closing |
Open |
Range |
Volume |
Thu 04 December 2025 |
176.14 (-1.52%) |
176.01 |
168.95 - 178.05 |
0.0906 times |
Fri 28 November 2025 |
178.86 (-5.01%) |
188.01 |
162.44 - 196.80 |
0.6255 times |
Fri 31 October 2025 |
188.30 (-3.89%) |
195.00 |
179.65 - 217.10 |
0.8653 times |
Tue 30 September 2025 |
195.92 (3.6%) |
184.55 |
178.43 - 219.82 |
1.0278 times |
Fri 29 August 2025 |
189.11 (-9.32%) |
200.15 |
183.85 - 216.85 |
0.8743 times |
Thu 31 July 2025 |
208.54 (7.6%) |
192.82 |
180.25 - 213.05 |
1.0809 times |
Mon 30 June 2025 |
193.81 (20.7%) |
160.60 |
160.18 - 198.20 |
1.0123 times |
Fri 30 May 2025 |
160.57 (23.87%) |
137.67 |
133.73 - 166.00 |
1.3574 times |
Wed 30 April 2025 |
129.63 (10.38%) |
118.28 |
90.51 - 130.41 |
1.3949 times |
Mon 31 March 2025 |
117.44 (-12.14%) |
133.66 |
104.34 - 138.74 |
1.6711 times |
Fri 28 February 2025 |
133.66 (-20.45%) |
157.50 |
124.05 - 176.36 |
1.5456 times |
DMA SMA EMA moving averages of Vistra Energy VST
DMA (daily moving average) of Vistra Energy VST
| DMA period | DMA value | | 5 day DMA | 174.58 | | 12 day DMA | 174.31 | | 20 day DMA | 176.71 | | 35 day DMA | 183.89 | | 50 day DMA | 189.93 | | 100 day DMA | 193.84 | | 150 day DMA | 184.49 | | 200 day DMA | 169.55 | EMA (exponential moving average) of Vistra Energy VST
| EMA period | EMA current | EMA prev | EMA prev2 | | 5 day EMA | 174.31 | 173.4 | 174.27 | | 12 day EMA | 175.3 | 175.15 | 175.79 | | 20 day EMA | 177.87 | 178.05 | 178.72 | | 35 day EMA | 183.59 | 184.03 | 184.76 | | 50 day EMA | 190.08 | 190.65 | 191.42 |
SMA (simple moving average) of Vistra Energy VST
| SMA period | SMA current | SMA prev | SMA prev2 | | 5 day SMA | 174.58 | 174.73 | 174.57 | | 12 day SMA | 174.31 | 174.21 | 174.46 | | 20 day SMA | 176.71 | 177.38 | 178.08 | | 35 day SMA | 183.89 | 184.88 | 185.85 | | 50 day SMA | 189.93 | 190.63 | 191.4 | | 100 day SMA | 193.84 | 194.04 | 194.29 | | 150 day SMA | 184.49 | 184.16 | 183.84 | | 200 day SMA | 169.55 | 169.5 | 169.48 |
|
|
