VishayIntertechnology VSH full analysis,charts,indicators,moving averages,SMA,DMA,EMA,ADX,MACD,RSIVishay Intertechnology VSH WideScreen charts, DMA,SMA,EMA technical analysis, forecast prediction, by indicators ADX,MACD,RSI,CCI USA stock exchange
operates under Capital Goods sector & deals in Electrical Products
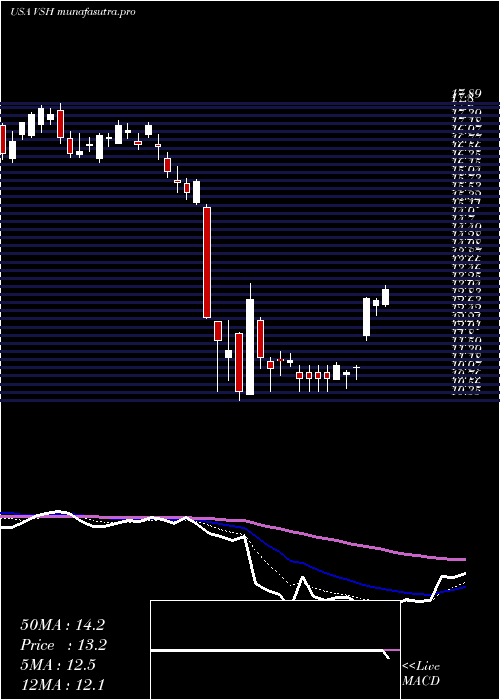
Daily price and charts and targets VishayIntertechnology Strong Daily Stock price targets for VishayIntertechnology VSH are 16.88 and 17.44 | Daily Target 1 | 16.77 | | Daily Target 2 | 16.99 | | Daily Target 3 | 17.326666666667 | | Daily Target 4 | 17.55 | | Daily Target 5 | 17.89 |
Daily price and volume Vishay Intertechnology
| Date |
Closing |
Open |
Range |
Volume |
Tue 21 October 2025 |
17.22 (-1.6%) |
17.54 |
17.10 - 17.66 |
0.6667 times |
Mon 20 October 2025 |
17.50 (6.12%) |
16.72 |
16.67 - 17.75 |
1.5303 times |
Fri 17 October 2025 |
16.49 (-2.54%) |
16.71 |
16.32 - 16.83 |
1.266 times |
Thu 16 October 2025 |
16.92 (-0.29%) |
17.14 |
16.81 - 17.35 |
1.2174 times |
Wed 15 October 2025 |
16.97 (5.8%) |
16.41 |
16.15 - 17.13 |
1.3566 times |
Tue 14 October 2025 |
16.04 (1.01%) |
15.38 |
15.38 - 16.29 |
0.6067 times |
Mon 13 October 2025 |
15.88 (8.32%) |
15.18 |
15.02 - 15.89 |
0.8557 times |
Fri 10 October 2025 |
14.66 (-7.74%) |
15.92 |
14.65 - 16.02 |
0.8538 times |
Thu 09 October 2025 |
15.89 (-1.06%) |
16.07 |
15.66 - 16.16 |
0.6614 times |
Wed 08 October 2025 |
16.06 (4.49%) |
15.46 |
15.32 - 16.07 |
0.9853 times |
Tue 07 October 2025 |
15.37 (-4.42%) |
16.20 |
15.24 - 16.20 |
0.7095 times |
Weekly price and charts VishayIntertechnology Strong weekly Stock price targets for VishayIntertechnology VSH are 16.95 and 18.03 | Weekly Target 1 | 16.13 | | Weekly Target 2 | 16.68 | | Weekly Target 3 | 17.213333333333 | | Weekly Target 4 | 17.76 | | Weekly Target 5 | 18.29 |
Weekly price and volumes for Vishay Intertechnology
| Date |
Closing |
Open |
Range |
Volume |
Tue 21 October 2025 |
17.22 (4.43%) |
16.72 |
16.67 - 17.75 |
0.6245 times |
Fri 17 October 2025 |
16.49 (12.48%) |
15.18 |
15.02 - 17.35 |
1.5073 times |
Fri 10 October 2025 |
14.66 (-9.23%) |
16.25 |
14.65 - 16.80 |
1.0286 times |
Fri 03 October 2025 |
16.15 (7.45%) |
15.15 |
14.86 - 16.61 |
1.0585 times |
Fri 26 September 2025 |
15.03 (-2.15%) |
15.40 |
14.67 - 15.86 |
1.0609 times |
Fri 19 September 2025 |
15.36 (0.72%) |
15.22 |
14.95 - 15.95 |
1.5831 times |
Fri 12 September 2025 |
15.25 (-1.99%) |
15.66 |
15.08 - 15.66 |
1.0008 times |
Fri 05 September 2025 |
15.56 (0.65%) |
15.02 |
14.56 - 15.78 |
0.7202 times |
Fri 29 August 2025 |
15.46 (0%) |
15.64 |
15.36 - 15.67 |
0.2218 times |
Fri 29 August 2025 |
15.46 (-0.77%) |
15.48 |
15.15 - 15.73 |
1.1944 times |
Fri 22 August 2025 |
15.58 (4.99%) |
14.72 |
14.42 - 15.59 |
1.2294 times |
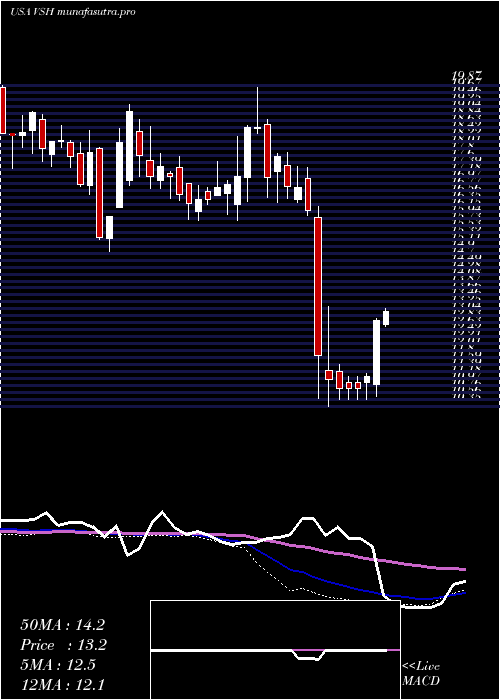
Monthly price and charts VishayIntertechnology Strong monthly Stock price targets for VishayIntertechnology VSH are 15.94 and 19.04 | Monthly Target 1 | 13.44 | | Monthly Target 2 | 15.33 | | Monthly Target 3 | 16.54 | | Monthly Target 4 | 18.43 | | Monthly Target 5 | 19.64 |
Monthly price and volumes Vishay Intertechnology
| Date |
Closing |
Open |
Range |
Volume |
Tue 21 October 2025 |
17.22 (12.55%) |
15.25 |
14.65 - 17.75 |
0.558 times |
Tue 30 September 2025 |
15.30 (-1.03%) |
15.02 |
14.56 - 15.95 |
0.7337 times |
Fri 29 August 2025 |
15.46 (-5.67%) |
15.96 |
13.03 - 16.34 |
1.125 times |
Thu 31 July 2025 |
16.39 (3.21%) |
15.70 |
15.64 - 18.20 |
0.8654 times |
Mon 30 June 2025 |
15.88 (12.86%) |
14.01 |
13.77 - 16.24 |
0.8258 times |
Fri 30 May 2025 |
14.07 (8.31%) |
13.24 |
12.00 - 15.35 |
1.0395 times |
Wed 30 April 2025 |
12.99 (-18.3%) |
15.87 |
10.35 - 15.99 |
1.6144 times |
Mon 31 March 2025 |
15.90 (-7.23%) |
17.33 |
15.64 - 17.89 |
1.1951 times |
Fri 28 February 2025 |
17.14 (1.24%) |
16.35 |
15.88 - 19.81 |
1.1328 times |
Fri 31 January 2025 |
16.93 (-0.06%) |
17.10 |
15.87 - 17.78 |
0.9103 times |
Tue 31 December 2024 |
16.94 (-6.87%) |
18.75 |
16.74 - 19.30 |
1.3688 times |

DMA SMA EMA moving averages of Vishay Intertechnology VSH
DMA (daily moving average) of Vishay Intertechnology VSH
| DMA period | DMA value | | 5 day DMA | 17.02 | | 12 day DMA | 16.26 | | 20 day DMA | 15.9 | | 35 day DMA | 15.65 | | 50 day DMA | 15.51 | | 100 day DMA | 15.77 | | 150 day DMA | 15.06 | | 200 day DMA | 15.59 | EMA (exponential moving average) of Vishay Intertechnology VSH
| EMA period | EMA current | EMA prev | EMA prev2 | | 5 day EMA | 16.93 | 16.79 | 16.43 | | 12 day EMA | 16.44 | 16.3 | 16.08 | | 20 day EMA | 16.13 | 16.02 | 15.86 | | 35 day EMA | 15.8 | 15.72 | 15.61 | | 50 day EMA | 15.56 | 15.49 | 15.41 |
SMA (simple moving average) of Vishay Intertechnology VSH
| SMA period | SMA current | SMA prev | SMA prev2 | | 5 day SMA | 17.02 | 16.78 | 16.46 | | 12 day SMA | 16.26 | 16.17 | 16.03 | | 20 day SMA | 15.9 | 15.8 | 15.7 | | 35 day SMA | 15.65 | 15.58 | 15.53 | | 50 day SMA | 15.51 | 15.46 | 15.39 | | 100 day SMA | 15.77 | 15.74 | 15.71 | | 150 day SMA | 15.06 | 15.06 | 15.05 | | 200 day SMA | 15.59 | 15.59 | 15.58 |
|
|
