VseCorporation VSEC full analysis,charts,indicators,moving averages,SMA,DMA,EMA,ADX,MACD,RSIVse Corporation VSEC WideScreen charts, DMA,SMA,EMA technical analysis, forecast prediction, by indicators ADX,MACD,RSI,CCI USA stock exchange
operates under Consumer Services sector & deals in Military Government Technical
Daily price and charts and targets VseCorporation Strong Daily Stock price targets for VseCorporation VSEC are 167.01 and 173.21 | Daily Target 1 | 161.9 | | Daily Target 2 | 165.91 | | Daily Target 3 | 168.09666666667 | | Daily Target 4 | 172.11 | | Daily Target 5 | 174.3 |
Daily price and volume Vse Corporation
| Date |
Closing |
Open |
Range |
Volume |
Tue 21 October 2025 |
169.93 (2.2%) |
166.20 |
164.08 - 170.28 |
1.0937 times |
Mon 20 October 2025 |
166.27 (4.27%) |
161.30 |
161.30 - 166.89 |
1.2624 times |
Fri 17 October 2025 |
159.46 (2.02%) |
156.86 |
155.50 - 159.70 |
1.0997 times |
Thu 16 October 2025 |
156.30 (-0.7%) |
158.14 |
155.99 - 159.53 |
0.7721 times |
Wed 15 October 2025 |
157.40 (-1.36%) |
161.66 |
156.63 - 164.03 |
1.1522 times |
Tue 14 October 2025 |
159.57 (1.17%) |
156.64 |
154.76 - 161.31 |
0.8973 times |
Mon 13 October 2025 |
157.73 (1.79%) |
155.40 |
154.78 - 158.13 |
0.8073 times |
Fri 10 October 2025 |
154.96 (-2.61%) |
159.38 |
154.67 - 162.07 |
1.1177 times |
Thu 09 October 2025 |
159.11 (-3.3%) |
164.98 |
158.34 - 165.43 |
1.0525 times |
Wed 08 October 2025 |
164.54 (1.17%) |
163.99 |
162.23 - 166.30 |
0.7451 times |
Tue 07 October 2025 |
162.63 (-0.44%) |
163.63 |
161.90 - 165.91 |
1.1454 times |
Weekly price and charts VseCorporation Strong weekly Stock price targets for VseCorporation VSEC are 165.62 and 174.6 | Weekly Target 1 | 158.19 | | Weekly Target 2 | 164.06 | | Weekly Target 3 | 167.17 | | Weekly Target 4 | 173.04 | | Weekly Target 5 | 176.15 |
Weekly price and volumes for Vse Corporation
| Date |
Closing |
Open |
Range |
Volume |
Tue 21 October 2025 |
169.93 (6.57%) |
161.30 |
161.30 - 170.28 |
0.3491 times |
Fri 17 October 2025 |
159.46 (2.9%) |
155.40 |
154.76 - 164.03 |
0.7007 times |
Fri 10 October 2025 |
154.96 (-5.68%) |
165.97 |
154.67 - 167.23 |
0.7761 times |
Fri 03 October 2025 |
164.29 (-0.12%) |
166.25 |
160.40 - 169.55 |
0.9507 times |
Fri 26 September 2025 |
164.48 (2.2%) |
159.45 |
157.00 - 169.22 |
1.0366 times |
Fri 19 September 2025 |
160.94 (-2.17%) |
165.33 |
155.68 - 174.55 |
3.1008 times |
Fri 12 September 2025 |
164.51 (-1.04%) |
167.21 |
160.00 - 169.78 |
0.9854 times |
Fri 05 September 2025 |
166.24 (2.36%) |
159.28 |
159.05 - 167.53 |
0.9194 times |
Fri 29 August 2025 |
162.40 (0%) |
162.94 |
158.21 - 162.94 |
0.2224 times |
Fri 29 August 2025 |
162.40 (-2.75%) |
167.00 |
158.21 - 168.80 |
0.9589 times |
Fri 22 August 2025 |
167.00 (3.19%) |
161.57 |
157.39 - 169.00 |
1.2973 times |
Monthly price and charts VseCorporation Strong monthly Stock price targets for VseCorporation VSEC are 162.3 and 177.91 | Monthly Target 1 | 149.35 | | Monthly Target 2 | 159.64 | | Monthly Target 3 | 164.96 | | Monthly Target 4 | 175.25 | | Monthly Target 5 | 180.57 |
Monthly price and volumes Vse Corporation
| Date |
Closing |
Open |
Range |
Volume |
Tue 21 October 2025 |
169.93 (2.22%) |
164.57 |
154.67 - 170.28 |
0.4301 times |
Tue 30 September 2025 |
166.24 (2.36%) |
159.28 |
155.68 - 174.55 |
1.2284 times |
Fri 29 August 2025 |
162.40 (3.74%) |
153.44 |
143.77 - 169.00 |
1.1347 times |
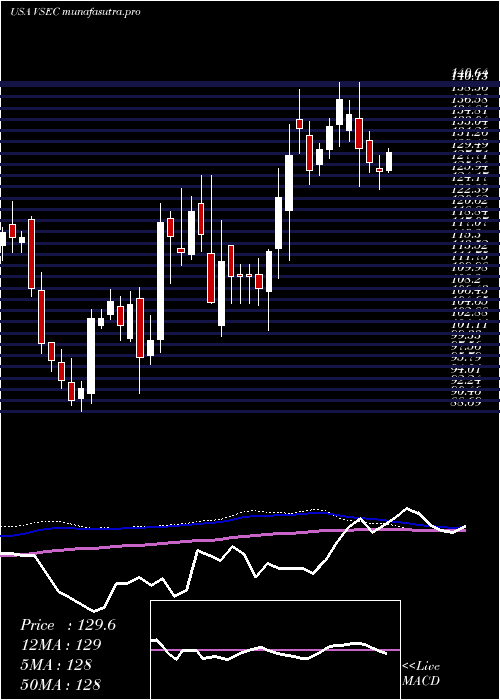
Thu 31 July 2025 |
156.54 (19.51%) |
129.96 |
123.69 - 158.11 |
0.8076 times |
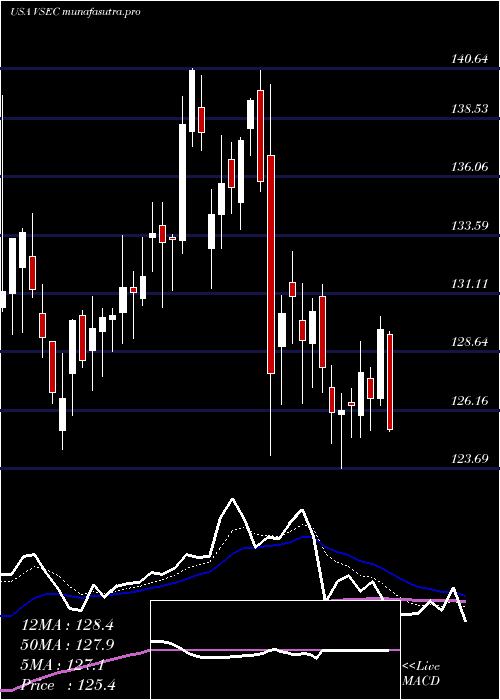
Mon 30 June 2025 |
130.98 (0.68%) |
130.00 |
124.24 - 140.64 |
0.9553 times |
Fri 30 May 2025 |
130.09 (13.6%) |
116.30 |
112.50 - 139.51 |
1.2366 times |
Wed 30 April 2025 |
114.52 (-4.56%) |
120.13 |
100.53 - 126.00 |
1.1291 times |
Mon 31 March 2025 |
119.99 (1.26%) |
119.22 |
108.86 - 126.03 |
1.0012 times |
Fri 28 February 2025 |
118.50 (15.78%) |
100.24 |
91.55 - 121.50 |
0.9673 times |
Fri 31 January 2025 |
102.35 (7.62%) |
95.60 |
88.69 - 108.00 |
1.1097 times |
Tue 31 December 2024 |
95.10 (-18.2%) |
119.10 |
94.13 - 119.56 |
0.9031 times |
DMA SMA EMA moving averages of Vse Corporation VSEC
DMA (daily moving average) of Vse Corporation VSEC
| DMA period | DMA value | | 5 day DMA | 161.87 | | 12 day DMA | 160.94 | | 20 day DMA | 162.26 | | 35 day DMA | 163.96 | | 50 day DMA | 163.84 | | 100 day DMA | 150 | | 150 day DMA | 139.74 | | 200 day DMA | 130.84 | EMA (exponential moving average) of Vse Corporation VSEC
| EMA period | EMA current | EMA prev | EMA prev2 | | 5 day EMA | 164 | 161.03 | 158.41 | | 12 day EMA | 162.3 | 160.91 | 159.93 | | 20 day EMA | 162.46 | 161.67 | 161.19 | | 35 day EMA | 162.58 | 162.15 | 161.91 | | 50 day EMA | 163.11 | 162.83 | 162.69 |
SMA (simple moving average) of Vse Corporation VSEC
| SMA period | SMA current | SMA prev | SMA prev2 | | 5 day SMA | 161.87 | 159.8 | 158.09 | | 12 day SMA | 160.94 | 160.47 | 160.42 | | 20 day SMA | 162.26 | 162.15 | 162.07 | | 35 day SMA | 163.96 | 163.78 | 163.67 | | 50 day SMA | 163.84 | 163.74 | 163.49 | | 100 day SMA | 150 | 149.59 | 149.22 | | 150 day SMA | 139.74 | 139.36 | 139.01 | | 200 day SMA | 130.84 | 130.46 | 130.1 |
|
|
