VirtusInvestment VRTS full analysis,charts,indicators,moving averages,SMA,DMA,EMA,ADX,MACD,RSIVirtus Investment VRTS WideScreen charts, DMA,SMA,EMA technical analysis, forecast prediction, by indicators ADX,MACD,RSI,CCI USA stock exchange
operates under Finance sector & deals in Investment Managers
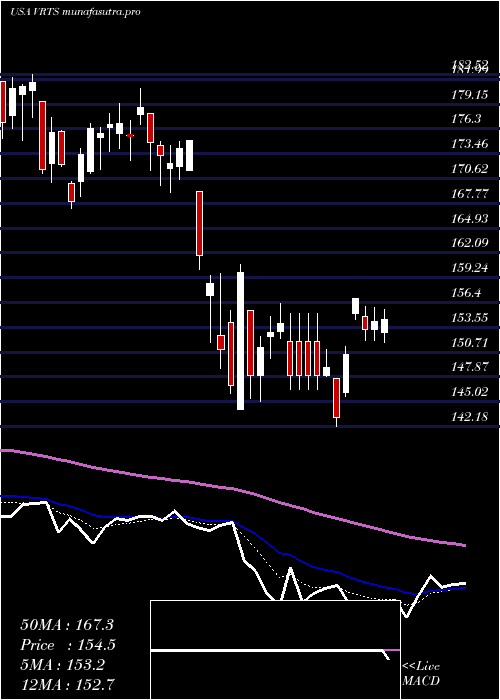
Daily price and charts and targets VirtusInvestment Strong Daily Stock price targets for VirtusInvestment VRTS are 176.56 and 183.25 | Daily Target 1 | 175.23 | | Daily Target 2 | 177.89 | | Daily Target 3 | 181.91666666667 | | Daily Target 4 | 184.58 | | Daily Target 5 | 188.61 |
Daily price and volume Virtus Investment
| Date |
Closing |
Open |
Range |
Volume |
Mon 20 October 2025 |
180.56 (-1.81%) |
184.91 |
179.25 - 185.94 |
1.0092 times |
Fri 17 October 2025 |
183.89 (0.43%) |
183.04 |
180.80 - 184.20 |
1.1124 times |
Thu 16 October 2025 |
183.10 (-4.54%) |
192.00 |
182.75 - 192.00 |
0.7722 times |
Wed 15 October 2025 |
191.81 (-0.62%) |
195.00 |
188.88 - 195.00 |
1.7189 times |
Tue 14 October 2025 |
193.00 (2.69%) |
185.71 |
185.71 - 194.06 |
1.1417 times |
Mon 13 October 2025 |
187.95 (2.16%) |
186.64 |
184.31 - 188.49 |
0.7875 times |
Fri 10 October 2025 |
183.97 (-5.05%) |
194.91 |
183.88 - 195.00 |
0.8881 times |
Thu 09 October 2025 |
193.76 (0.56%) |
193.48 |
190.11 - 193.76 |
0.7263 times |
Wed 08 October 2025 |
192.69 (0.75%) |
193.12 |
191.55 - 194.55 |
0.6613 times |
Tue 07 October 2025 |
191.26 (-0.63%) |
192.36 |
190.38 - 194.70 |
1.1825 times |
Mon 06 October 2025 |
192.48 (0.35%) |
193.38 |
190.17 - 195.00 |
0.2724 times |
Weekly price and charts VirtusInvestment Strong weekly Stock price targets for VirtusInvestment VRTS are 176.56 and 183.25 | Weekly Target 1 | 175.23 | | Weekly Target 2 | 177.89 | | Weekly Target 3 | 181.91666666667 | | Weekly Target 4 | 184.58 | | Weekly Target 5 | 188.61 |
Weekly price and volumes for Virtus Investment
| Date |
Closing |
Open |
Range |
Volume |
Mon 20 October 2025 |
180.56 (-1.81%) |
184.91 |
179.25 - 185.94 |
0.2361 times |
Fri 17 October 2025 |
183.89 (-0.04%) |
186.64 |
180.80 - 195.00 |
1.2946 times |
Fri 10 October 2025 |
183.97 (-4.09%) |
193.38 |
183.88 - 195.00 |
0.8729 times |
Fri 03 October 2025 |
191.81 (-0.22%) |
192.49 |
184.70 - 193.71 |
1.3077 times |
Fri 26 September 2025 |
192.24 (0.82%) |
190.90 |
187.46 - 195.00 |
1.7078 times |
Fri 19 September 2025 |
190.67 (-3.73%) |
198.52 |
188.99 - 198.68 |
1.0692 times |
Fri 12 September 2025 |
198.05 (2.1%) |
196.12 |
191.17 - 203.61 |
0.9159 times |
Fri 05 September 2025 |
193.98 (-3.7%) |
199.58 |
190.93 - 200.00 |
1.0674 times |
Fri 29 August 2025 |
201.43 (0%) |
201.14 |
198.52 - 202.31 |
0.246 times |
Fri 29 August 2025 |
201.43 (0.58%) |
199.06 |
196.94 - 203.15 |
1.2824 times |
Fri 22 August 2025 |
200.26 (3.18%) |
192.25 |
188.70 - 201.09 |
1.1449 times |
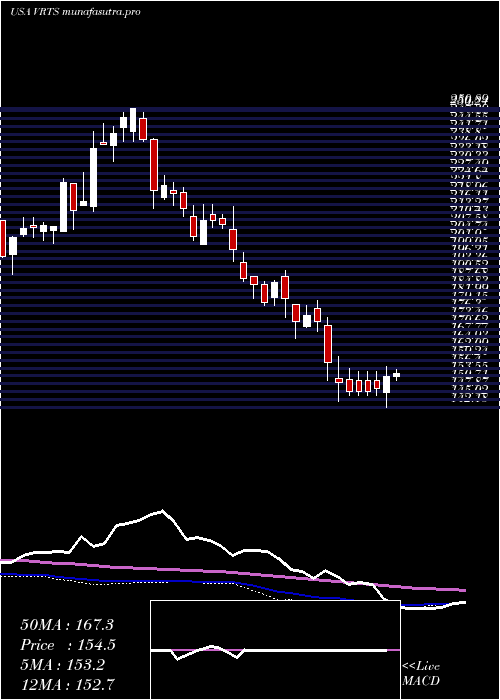
Monthly price and charts VirtusInvestment Strong monthly Stock price targets for VirtusInvestment VRTS are 172.03 and 187.78 | Monthly Target 1 | 169.19 | | Monthly Target 2 | 174.87 | | Monthly Target 3 | 184.93666666667 | | Monthly Target 4 | 190.62 | | Monthly Target 5 | 200.69 |
Monthly price and volumes Virtus Investment
| Date |
Closing |
Open |
Range |
Volume |
Mon 20 October 2025 |
180.56 (-4.98%) |
187.84 |
179.25 - 195.00 |
0.6836 times |
Tue 30 September 2025 |
190.03 (-5.66%) |
199.58 |
187.02 - 203.61 |
1.3081 times |
Fri 29 August 2025 |
201.43 (4.2%) |
190.21 |
185.93 - 203.15 |
1.1052 times |
Thu 31 July 2025 |
193.31 (6.57%) |
181.11 |
181.07 - 215.06 |
1.6552 times |
Mon 30 June 2025 |
181.40 (6.27%) |
169.51 |
167.80 - 186.23 |
2.0254 times |
Fri 30 May 2025 |
170.70 (11.14%) |
152.85 |
152.05 - 180.08 |
0.7668 times |
Wed 30 April 2025 |
153.59 (-10.89%) |
171.97 |
142.18 - 175.03 |
0.7182 times |
Mon 31 March 2025 |
172.36 (-8.21%) |
189.67 |
167.13 - 192.00 |
0.6573 times |
Fri 28 February 2025 |
187.77 (-5.88%) |
194.86 |
179.38 - 198.48 |
0.511 times |
Fri 31 January 2025 |
199.50 (-9.56%) |
223.96 |
195.15 - 223.96 |
0.5691 times |
Tue 31 December 2024 |
220.58 (-10.94%) |
245.81 |
214.68 - 250.89 |
0.4893 times |

DMA SMA EMA moving averages of Virtus Investment VRTS
DMA (daily moving average) of Virtus Investment VRTS
| DMA period | DMA value | | 5 day DMA | 186.47 | | 12 day DMA | 188.86 | | 20 day DMA | 189.27 | | 35 day DMA | 191.67 | | 50 day DMA | 193.25 | | 100 day DMA | 190.92 | | 150 day DMA | 181.69 | | 200 day DMA | 184.92 | EMA (exponential moving average) of Virtus Investment VRTS
| EMA period | EMA current | EMA prev | EMA prev2 | | 5 day EMA | 184.72 | 186.8 | 188.25 | | 12 day EMA | 187.45 | 188.7 | 189.57 | | 20 day EMA | 188.94 | 189.82 | 190.44 | | 35 day EMA | 190.66 | 191.25 | 191.68 | | 50 day EMA | 192.23 | 192.71 | 193.07 |
SMA (simple moving average) of Virtus Investment VRTS
| SMA period | SMA current | SMA prev | SMA prev2 | | 5 day SMA | 186.47 | 187.95 | 187.97 | | 12 day SMA | 188.86 | 189.47 | 189.64 | | 20 day SMA | 189.27 | 189.82 | 190.15 | | 35 day SMA | 191.67 | 192.27 | 192.77 | | 50 day SMA | 193.25 | 193.43 | 193.55 | | 100 day SMA | 190.92 | 190.84 | 190.67 | | 150 day SMA | 181.69 | 181.64 | 181.53 | | 200 day SMA | 184.92 | 185.11 | 185.29 |
|
|
