VarexImaging VREX full analysis,charts,indicators,moving averages,SMA,DMA,EMA,ADX,MACD,RSIVarex Imaging VREX WideScreen charts, DMA,SMA,EMA technical analysis, forecast prediction, by indicators ADX,MACD,RSI,CCI USA stock exchange
operates under Capital Goods sector & deals in Industrial Machinery Components
Daily price and charts and targets VarexImaging Strong Daily Stock price targets for VarexImaging VREX are 11.48 and 11.76 | Daily Target 1 | 11.27 | | Daily Target 2 | 11.4 | | Daily Target 3 | 11.546666666667 | | Daily Target 4 | 11.68 | | Daily Target 5 | 11.83 |
Daily price and volume Varex Imaging
| Date |
Closing |
Open |
Range |
Volume |
Thu 04 December 2025 |
11.54 (0.7%) |
11.42 |
11.41 - 11.69 |
0.5709 times |
Wed 03 December 2025 |
11.46 (1.15%) |
11.45 |
11.23 - 11.74 |
0.7326 times |
Tue 02 December 2025 |
11.33 (-1.65%) |
11.62 |
11.30 - 11.71 |
0.6552 times |
Mon 01 December 2025 |
11.52 (-0.43%) |
11.46 |
11.31 - 11.76 |
0.7313 times |
Fri 28 November 2025 |
11.57 (0%) |
11.55 |
11.42 - 11.83 |
0.4328 times |
Wed 26 November 2025 |
11.57 (3.21%) |
11.19 |
11.17 - 11.65 |
0.8824 times |
Tue 25 November 2025 |
11.21 (1.72%) |
11.09 |
10.92 - 11.52 |
1.1946 times |
Mon 24 November 2025 |
11.02 (3.28%) |
10.68 |
10.58 - 11.13 |
1.0841 times |
Fri 21 November 2025 |
10.67 (3.69%) |
10.30 |
10.09 - 10.91 |
1.4603 times |
Thu 20 November 2025 |
10.29 (0.49%) |
10.45 |
10.12 - 11.10 |
2.2557 times |
Wed 19 November 2025 |
10.24 (-13.66%) |
10.77 |
9.81 - 11.56 |
2.5115 times |
Weekly price and charts VarexImaging Strong weekly Stock price targets for VarexImaging VREX are 11.39 and 11.92 | Weekly Target 1 | 10.98 | | Weekly Target 2 | 11.26 | | Weekly Target 3 | 11.51 | | Weekly Target 4 | 11.79 | | Weekly Target 5 | 12.04 |
Weekly price and volumes for Varex Imaging
| Date |
Closing |
Open |
Range |
Volume |
Thu 04 December 2025 |
11.54 (-0.26%) |
11.46 |
11.23 - 11.76 |
0.825 times |
Fri 28 November 2025 |
11.57 (8.43%) |
10.68 |
10.58 - 11.83 |
1.1021 times |
Fri 21 November 2025 |
10.67 (-10.49%) |
11.84 |
9.81 - 12.35 |
2.6144 times |
Fri 14 November 2025 |
11.92 (-0.42%) |
12.11 |
11.59 - 12.65 |
0.9275 times |
Fri 07 November 2025 |
11.97 (2.4%) |
11.83 |
11.54 - 12.12 |
0.5893 times |
Fri 31 October 2025 |
11.69 (0%) |
12.01 |
11.38 - 12.14 |
0.2083 times |
Fri 31 October 2025 |
11.69 (-2.5%) |
12.00 |
11.38 - 12.74 |
1.0165 times |
Fri 24 October 2025 |
11.99 (3.99%) |
11.71 |
11.15 - 12.06 |
0.8897 times |
Fri 17 October 2025 |
11.53 (6.66%) |
11.03 |
10.84 - 11.84 |
0.8438 times |
Fri 10 October 2025 |
10.81 (-9.46%) |
12.00 |
10.78 - 12.10 |
0.9835 times |
Fri 03 October 2025 |
11.94 (-1%) |
12.15 |
11.76 - 12.42 |
1.0305 times |
Monthly price and charts VarexImaging Strong monthly Stock price targets for VarexImaging VREX are 11.39 and 11.92 | Monthly Target 1 | 10.98 | | Monthly Target 2 | 11.26 | | Monthly Target 3 | 11.51 | | Monthly Target 4 | 11.79 | | Monthly Target 5 | 12.04 |
Monthly price and volumes Varex Imaging
| Date |
Closing |
Open |
Range |
Volume |
Thu 04 December 2025 |
11.54 (-0.26%) |
11.46 |
11.23 - 11.76 |
0.134 times |
Fri 28 November 2025 |
11.57 (-1.03%) |
11.83 |
9.81 - 12.65 |
0.8502 times |
Fri 31 October 2025 |
11.69 (-5.73%) |
12.28 |
10.78 - 12.74 |
0.7335 times |
Tue 30 September 2025 |
12.40 (7.36%) |
11.33 |
10.79 - 12.53 |
1.0029 times |
Fri 29 August 2025 |
11.55 (58.65%) |
7.12 |
6.76 - 11.95 |
1.4891 times |
Thu 31 July 2025 |
7.28 (-16.03%) |
8.56 |
7.19 - 8.84 |
0.7974 times |
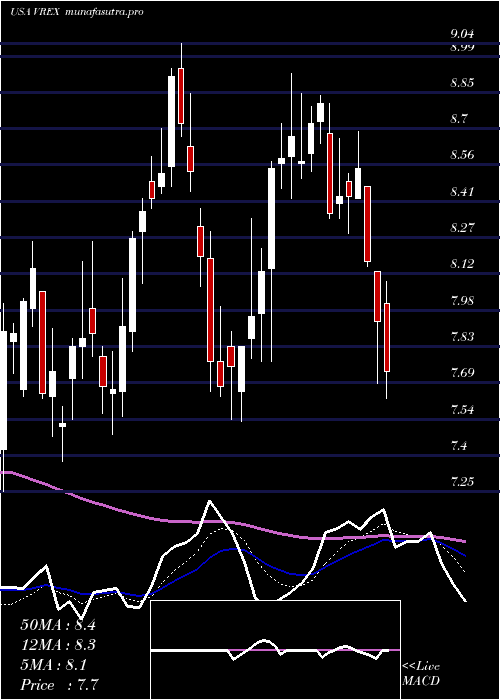
Mon 30 June 2025 |
8.67 (13.04%) |
7.64 |
7.48 - 9.04 |
1.1037 times |
Fri 30 May 2025 |
7.67 (-7.81%) |
8.32 |
6.76 - 8.86 |
1.3912 times |
Wed 30 April 2025 |
8.32 (-28.28%) |
11.54 |
6.97 - 11.59 |
1.725 times |
Mon 31 March 2025 |
11.60 (-9.8%) |
12.95 |
11.31 - 13.10 |
0.7729 times |
Fri 28 February 2025 |
12.86 (-6.4%) |
13.54 |
11.80 - 15.46 |
1.5664 times |
DMA SMA EMA moving averages of Varex Imaging VREX
DMA (daily moving average) of Varex Imaging VREX
| DMA period | DMA value | | 5 day DMA | 11.48 | | 12 day DMA | 11.19 | | 20 day DMA | 11.52 | | 35 day DMA | 11.65 | | 50 day DMA | 11.68 | | 100 day DMA | 10.91 | | 150 day DMA | 9.98 | | 200 day DMA | 10.11 | EMA (exponential moving average) of Varex Imaging VREX
| EMA period | EMA current | EMA prev | EMA prev2 | | 5 day EMA | 11.45 | 11.4 | 11.37 | | 12 day EMA | 11.4 | 11.38 | 11.37 | | 20 day EMA | 11.47 | 11.46 | 11.46 | | 35 day EMA | 11.57 | 11.57 | 11.58 | | 50 day EMA | 11.7 | 11.71 | 11.72 |
SMA (simple moving average) of Varex Imaging VREX
| SMA period | SMA current | SMA prev | SMA prev2 | | 5 day SMA | 11.48 | 11.49 | 11.44 | | 12 day SMA | 11.19 | 11.18 | 11.22 | | 20 day SMA | 11.52 | 11.54 | 11.55 | | 35 day SMA | 11.65 | 11.65 | 11.65 | | 50 day SMA | 11.68 | 11.69 | 11.71 | | 100 day SMA | 10.91 | 10.87 | 10.83 | | 150 day SMA | 9.98 | 9.96 | 9.94 | | 200 day SMA | 10.11 | 10.12 | 10.13 |
|
|
