VerricaPharmaceuticals VRCA full analysis,charts,indicators,moving averages,SMA,DMA,EMA,ADX,MACD,RSIVerrica Pharmaceuticals VRCA WideScreen charts, DMA,SMA,EMA technical analysis, forecast prediction, by indicators ADX,MACD,RSI,CCI USA stock exchange
operates under Health Care sector & deals in Major Pharmaceuticals
Daily price and charts and targets VerricaPharmaceuticals Strong Daily Stock price targets for VerricaPharmaceuticals VRCA are 7.81 and 9.09 | Daily Target 1 | 6.75 | | Daily Target 2 | 7.59 | | Daily Target 3 | 8.0333333333333 | | Daily Target 4 | 8.87 | | Daily Target 5 | 9.31 |
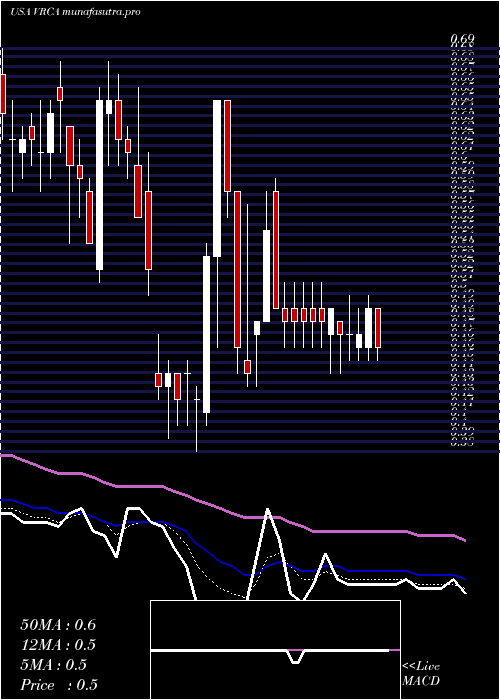
Daily price and volume Verrica Pharmaceuticals
| Date |
Closing |
Open |
Range |
Volume |
Thu 04 December 2025 |
8.42 (12.57%) |
7.43 |
7.20 - 8.48 |
0.3165 times |
Wed 03 December 2025 |
7.48 (10.98%) |
6.68 |
6.57 - 7.60 |
0.2902 times |
Tue 02 December 2025 |
6.74 (-10.73%) |
7.56 |
6.26 - 7.56 |
0.4825 times |
Mon 01 December 2025 |
7.55 (-17.03%) |
7.99 |
7.30 - 8.18 |
1.3808 times |
Fri 28 November 2025 |
9.10 (35.82%) |
7.30 |
6.92 - 9.82 |
4.2504 times |
Wed 26 November 2025 |
6.70 (30.86%) |
5.79 |
5.39 - 6.79 |
1.6818 times |
Tue 25 November 2025 |
5.12 (8.47%) |
4.80 |
4.73 - 5.32 |
0.3799 times |
Mon 24 November 2025 |
4.72 (12.11%) |
4.41 |
4.40 - 5.18 |
0.9433 times |
Fri 21 November 2025 |
4.21 (4.73%) |
4.09 |
3.90 - 4.26 |
0.0863 times |
Thu 20 November 2025 |
4.02 (-10.27%) |
4.47 |
3.90 - 4.64 |
0.1882 times |
Wed 19 November 2025 |
4.48 (16.97%) |
3.85 |
3.85 - 4.55 |
0.4465 times |
Weekly price and charts VerricaPharmaceuticals Strong weekly Stock price targets for VerricaPharmaceuticals VRCA are 7.34 and 9.56 | Weekly Target 1 | 5.5 | | Weekly Target 2 | 6.96 | | Weekly Target 3 | 7.72 | | Weekly Target 4 | 9.18 | | Weekly Target 5 | 9.94 |
Weekly price and volumes for Verrica Pharmaceuticals
| Date |
Closing |
Open |
Range |
Volume |
Thu 04 December 2025 |
8.42 (-7.47%) |
7.99 |
6.26 - 8.48 |
1.2474 times |
Fri 28 November 2025 |
9.10 (116.15%) |
4.41 |
4.40 - 9.82 |
3.664 times |
Fri 21 November 2025 |
4.21 (7.12%) |
3.84 |
3.64 - 4.64 |
0.5363 times |
Fri 14 November 2025 |
3.93 (13.58%) |
3.55 |
3.55 - 4.02 |
0.3023 times |
Fri 07 November 2025 |
3.46 (-4.16%) |
3.47 |
3.28 - 3.73 |
0.2013 times |
Fri 31 October 2025 |
3.61 (0%) |
3.49 |
3.47 - 3.68 |
0.027 times |
Fri 31 October 2025 |
3.61 (-6.23%) |
3.85 |
3.43 - 3.96 |
0.3474 times |
Fri 24 October 2025 |
3.85 (-7.23%) |
4.22 |
3.73 - 4.54 |
1.0155 times |
Fri 17 October 2025 |
4.15 (0.24%) |
4.15 |
3.93 - 4.35 |
0.3329 times |
Fri 10 October 2025 |
4.14 (-11.54%) |
4.75 |
4.09 - 4.85 |
2.3258 times |
Fri 03 October 2025 |
4.68 (11.96%) |
4.26 |
4.17 - 4.72 |
0.191 times |
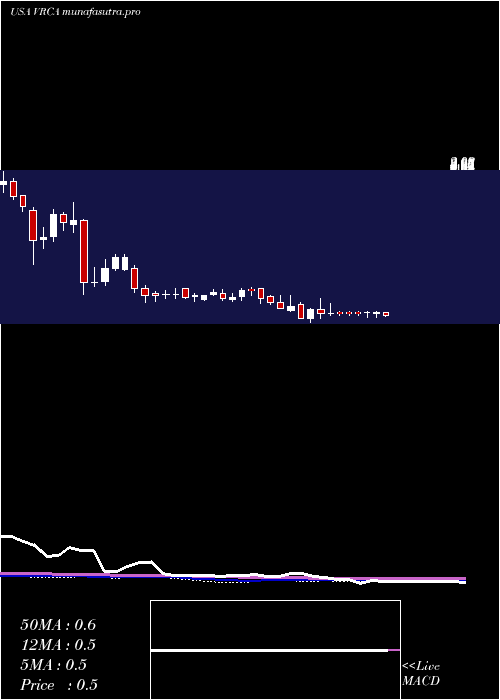
Monthly price and charts VerricaPharmaceuticals Strong monthly Stock price targets for VerricaPharmaceuticals VRCA are 7.34 and 9.56 | Monthly Target 1 | 5.5 | | Monthly Target 2 | 6.96 | | Monthly Target 3 | 7.72 | | Monthly Target 4 | 9.18 | | Monthly Target 5 | 9.94 |
Monthly price and volumes Verrica Pharmaceuticals
| Date |
Closing |
Open |
Range |
Volume |
Thu 04 December 2025 |
8.42 (-7.47%) |
7.99 |
6.26 - 8.48 |
0.2261 times |
Fri 28 November 2025 |
9.10 (152.08%) |
3.47 |
3.28 - 9.82 |
0.8527 times |
Fri 31 October 2025 |
3.61 (-16.24%) |
4.33 |
3.43 - 4.85 |
0.7569 times |
Tue 30 September 2025 |
4.31 (-23.04%) |
5.60 |
3.96 - 5.60 |
1.4052 times |
Fri 29 August 2025 |
5.60 (-0.53%) |
5.58 |
5.29 - 7.40 |
0.1409 times |
Thu 31 July 2025 |
5.63 (962.26%) |
0.54 |
0.53 - 7.13 |
1.9202 times |
Mon 30 June 2025 |
0.53 (8.16%) |
0.50 |
0.49 - 0.71 |
1.2314 times |
Fri 30 May 2025 |
0.49 (6.52%) |
0.48 |
0.39 - 0.73 |
0.8024 times |
Wed 30 April 2025 |
0.46 (4.55%) |
0.44 |
0.38 - 0.65 |
1.1907 times |
Mon 31 March 2025 |
0.44 (-32.31%) |
0.67 |
0.39 - 0.69 |
1.4734 times |
Fri 28 February 2025 |
0.65 (0%) |
0.64 |
0.59 - 0.78 |
0.7462 times |

DMA SMA EMA moving averages of Verrica Pharmaceuticals VRCA
DMA (daily moving average) of Verrica Pharmaceuticals VRCA
| DMA period | DMA value | | 5 day DMA | 7.86 | | 12 day DMA | 6.03 | | 20 day DMA | 5.11 | | 35 day DMA | 4.55 | | 50 day DMA | 4.49 | | 100 day DMA | 4.67 | | 150 day DMA | 3.32 | | 200 day DMA | 2.63 | EMA (exponential moving average) of Verrica Pharmaceuticals VRCA
| EMA period | EMA current | EMA prev | EMA prev2 | | 5 day EMA | 7.51 | 7.05 | 6.83 | | 12 day EMA | 6.43 | 6.07 | 5.81 | | 20 day EMA | 5.71 | 5.43 | 5.21 | | 35 day EMA | 5.14 | 4.95 | 4.8 | | 50 day EMA | 4.81 | 4.66 | 4.54 |
SMA (simple moving average) of Verrica Pharmaceuticals VRCA
| SMA period | SMA current | SMA prev | SMA prev2 | | 5 day SMA | 7.86 | 7.51 | 7.04 | | 12 day SMA | 6.03 | 5.64 | 5.34 | | 20 day SMA | 5.11 | 4.87 | 4.66 | | 35 day SMA | 4.55 | 4.43 | 4.33 | | 50 day SMA | 4.49 | 4.4 | 4.34 | | 100 day SMA | 4.67 | 4.6 | 4.53 | | 150 day SMA | 3.32 | 3.26 | 3.22 | | 200 day SMA | 2.63 | 2.59 | 2.55 |
|
|
