VodafoneGroup VOD full analysis,charts,indicators,moving averages,SMA,DMA,EMA,ADX,MACD,RSIVodafone Group VOD WideScreen charts, DMA,SMA,EMA technical analysis, forecast prediction, by indicators ADX,MACD,RSI,CCI USA stock exchange
operates under Public Utilities sector & deals in Telecommunications Equipment
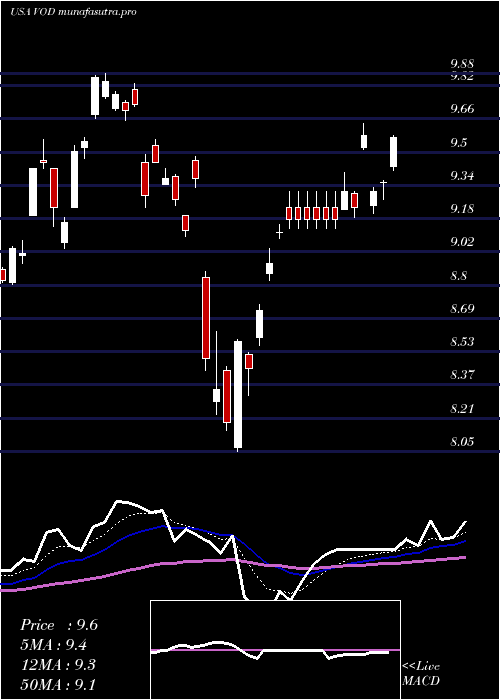
Daily price and charts and targets VodafoneGroup Strong Daily Stock price targets for VodafoneGroup VOD are 12.61 and 12.78 | Daily Target 1 | 12.49 | | Daily Target 2 | 12.56 | | Daily Target 3 | 12.66 | | Daily Target 4 | 12.73 | | Daily Target 5 | 12.83 |
Daily price and volume Vodafone Group
| Date |
Closing |
Open |
Range |
Volume |
Thu 04 December 2025 |
12.63 (0.32%) |
12.59 |
12.59 - 12.76 |
0.6173 times |
Wed 03 December 2025 |
12.59 (1.7%) |
12.57 |
12.54 - 12.64 |
1.3918 times |
Tue 02 December 2025 |
12.38 (2.06%) |
12.43 |
12.32 - 12.49 |
1.0483 times |
Mon 01 December 2025 |
12.13 (-2.73%) |
12.41 |
12.12 - 12.41 |
0.7649 times |
Fri 28 November 2025 |
12.47 (-0.08%) |
12.46 |
12.43 - 12.50 |
0.6917 times |
Wed 26 November 2025 |
12.48 (2.13%) |
12.30 |
12.30 - 12.49 |
1.0325 times |
Tue 25 November 2025 |
12.22 (3.3%) |
12.12 |
12.11 - 12.26 |
1.017 times |
Mon 24 November 2025 |
11.83 (-2.31%) |
11.72 |
11.71 - 11.86 |
1.3289 times |
Fri 21 November 2025 |
12.11 (2.19%) |
11.87 |
11.87 - 12.14 |
1.1745 times |
Thu 20 November 2025 |
11.85 (-1.33%) |
11.99 |
11.83 - 12.01 |
0.933 times |
Wed 19 November 2025 |
12.01 (-1.96%) |
12.11 |
11.94 - 12.11 |
0.7617 times |
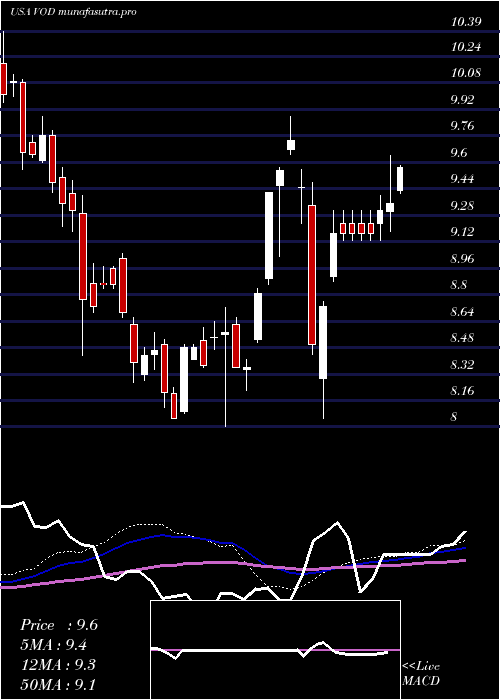
Weekly price and charts VodafoneGroup Strong weekly Stock price targets for VodafoneGroup VOD are 12.38 and 13.02 | Weekly Target 1 | 11.86 | | Weekly Target 2 | 12.25 | | Weekly Target 3 | 12.503333333333 | | Weekly Target 4 | 12.89 | | Weekly Target 5 | 13.14 |
Weekly price and volumes for Vodafone Group
| Date |
Closing |
Open |
Range |
Volume |
Thu 04 December 2025 |
12.63 (1.28%) |
12.41 |
12.12 - 12.76 |
0.9058 times |
Fri 28 November 2025 |
12.47 (2.97%) |
11.72 |
11.71 - 12.50 |
0.9646 times |
Fri 21 November 2025 |
12.11 (-1.7%) |
12.32 |
11.83 - 12.37 |
1.0284 times |
Fri 14 November 2025 |
12.32 (6.39%) |
11.57 |
11.52 - 12.72 |
1.1975 times |
Fri 07 November 2025 |
11.58 (-3.9%) |
11.17 |
11.12 - 11.61 |
0.8757 times |
Fri 31 October 2025 |
12.05 (0%) |
11.92 |
11.92 - 12.08 |
0.334 times |
Fri 31 October 2025 |
12.05 (2.73%) |
11.78 |
11.77 - 12.36 |
1.843 times |
Fri 24 October 2025 |
11.73 (0.51%) |
11.66 |
11.48 - 11.78 |
1.0066 times |
Fri 17 October 2025 |
11.67 (3.27%) |
11.19 |
11.15 - 11.67 |
0.8945 times |
Fri 10 October 2025 |
11.30 (-0.53%) |
11.24 |
11.18 - 11.42 |
0.9498 times |
Fri 03 October 2025 |
11.36 (-0.7%) |
11.45 |
11.32 - 11.66 |
1.0075 times |
Monthly price and charts VodafoneGroup Strong monthly Stock price targets for VodafoneGroup VOD are 12.38 and 13.02 | Monthly Target 1 | 11.86 | | Monthly Target 2 | 12.25 | | Monthly Target 3 | 12.503333333333 | | Monthly Target 4 | 12.89 | | Monthly Target 5 | 13.14 |
Monthly price and volumes Vodafone Group
| Date |
Closing |
Open |
Range |
Volume |
Thu 04 December 2025 |
12.63 (1.28%) |
12.41 |
12.12 - 12.76 |
0.1215 times |
Fri 28 November 2025 |
12.47 (3.49%) |
11.17 |
11.12 - 12.72 |
0.5456 times |
Fri 31 October 2025 |
12.05 (3.88%) |
11.57 |
11.15 - 12.36 |
0.7594 times |
Tue 30 September 2025 |
11.60 (-3.01%) |
11.45 |
11.22 - 11.94 |
0.5155 times |
Fri 29 August 2025 |
11.96 (10.64%) |
10.96 |
10.89 - 12.06 |
0.6098 times |
Thu 31 July 2025 |
10.81 (1.41%) |
10.84 |
10.61 - 11.67 |
0.9432 times |
Mon 30 June 2025 |
10.66 (3.09%) |
10.39 |
9.80 - 10.70 |
1.635 times |
Fri 30 May 2025 |
10.34 (5.94%) |
9.79 |
8.98 - 10.60 |
2.0369 times |
Wed 30 April 2025 |
9.76 (4.16%) |
9.38 |
8.05 - 9.78 |
1.5252 times |
Mon 31 March 2025 |
9.37 (6.36%) |
8.90 |
8.86 - 9.88 |
1.3079 times |
Fri 28 February 2025 |
8.81 (3.16%) |
8.56 |
8.00 - 8.84 |
1.1566 times |

DMA SMA EMA moving averages of Vodafone Group VOD
DMA (daily moving average) of Vodafone Group VOD
| DMA period | DMA value | | 5 day DMA | 12.44 | | 12 day DMA | 12.25 | | 20 day DMA | 12.18 | | 35 day DMA | 11.99 | | 50 day DMA | 11.8 | | 100 day DMA | 11.67 | | 150 day DMA | 11.16 | | 200 day DMA | 10.66 | EMA (exponential moving average) of Vodafone Group VOD
| EMA period | EMA current | EMA prev | EMA prev2 | | 5 day EMA | 12.47 | 12.39 | 12.29 | | 12 day EMA | 12.31 | 12.25 | 12.19 | | 20 day EMA | 12.2 | 12.16 | 12.11 | | 35 day EMA | 12 | 11.96 | 11.92 | | 50 day EMA | 11.83 | 11.8 | 11.77 |
SMA (simple moving average) of Vodafone Group VOD
| SMA period | SMA current | SMA prev | SMA prev2 | | 5 day SMA | 12.44 | 12.41 | 12.34 | | 12 day SMA | 12.25 | 12.21 | 12.19 | | 20 day SMA | 12.18 | 12.11 | 12.04 | | 35 day SMA | 11.99 | 11.95 | 11.92 | | 50 day SMA | 11.8 | 11.77 | 11.75 | | 100 day SMA | 11.67 | 11.65 | 11.63 | | 150 day SMA | 11.16 | 11.14 | 11.12 | | 200 day SMA | 10.66 | 10.63 | 10.61 |
|
|
