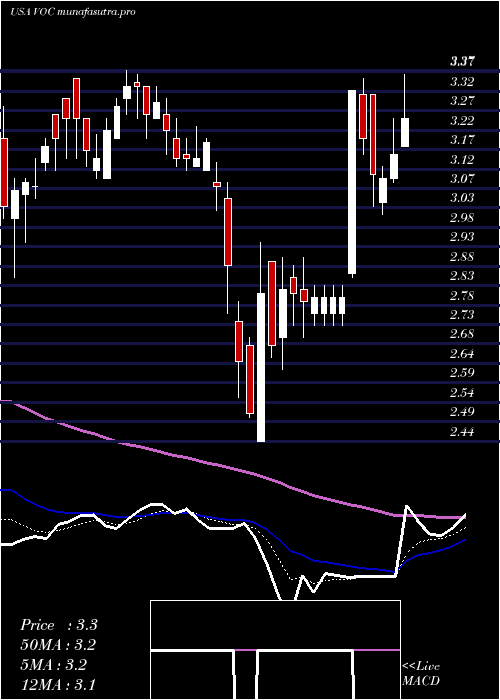
VocEnergy VOC full analysis,charts,indicators,moving averages,SMA,DMA,EMA,ADX,MACD,RSIVoc Energy VOC WideScreen charts, DMA,SMA,EMA technical analysis, forecast prediction, by indicators ADX,MACD,RSI,CCI USA stock exchange
operates under Energy sector & deals in Oil Gas Production
Daily price and charts and targets VocEnergy Strong Daily Stock price targets for VocEnergy VOC are 2.94 and 3 | Daily Target 1 | 2.89 | | Daily Target 2 | 2.92 | | Daily Target 3 | 2.9533333333333 | | Daily Target 4 | 2.98 | | Daily Target 5 | 3.01 |
Daily price and volume Voc Energy
| Date |
Closing |
Open |
Range |
Volume |
Mon 20 October 2025 |
2.94 (-0.68%) |
2.93 |
2.93 - 2.99 |
0.7399 times |
Fri 17 October 2025 |
2.96 (-0.34%) |
2.98 |
2.92 - 2.98 |
0.4292 times |
Thu 16 October 2025 |
2.97 (0.68%) |
2.96 |
2.93 - 3.05 |
0.9708 times |
Wed 15 October 2025 |
2.95 (2.43%) |
2.93 |
2.92 - 2.95 |
0.5939 times |
Tue 14 October 2025 |
2.88 (-2.37%) |
2.92 |
2.85 - 2.95 |
1 times |
Mon 13 October 2025 |
2.95 (0.34%) |
2.96 |
2.92 - 2.96 |
0.6815 times |
Fri 10 October 2025 |
2.94 (-1.67%) |
2.99 |
2.92 - 3.00 |
2.817 times |
Thu 09 October 2025 |
2.99 (-2.92%) |
3.07 |
2.99 - 3.08 |
0.8369 times |
Wed 08 October 2025 |
3.08 (0.65%) |
3.08 |
3.02 - 3.08 |
0.9616 times |
Tue 07 October 2025 |
3.06 (0.99%) |
3.01 |
2.99 - 3.08 |
0.9692 times |
Mon 06 October 2025 |
3.03 (-0.66%) |
3.06 |
2.97 - 3.06 |
0.8254 times |
Weekly price and charts VocEnergy Strong weekly Stock price targets for VocEnergy VOC are 2.94 and 3 | Weekly Target 1 | 2.89 | | Weekly Target 2 | 2.92 | | Weekly Target 3 | 2.9533333333333 | | Weekly Target 4 | 2.98 | | Weekly Target 5 | 3.01 |
Weekly price and volumes for Voc Energy
| Date |
Closing |
Open |
Range |
Volume |
Mon 20 October 2025 |
2.94 (-0.68%) |
2.93 |
2.93 - 2.99 |
0.2029 times |
Fri 17 October 2025 |
2.96 (0.68%) |
2.96 |
2.85 - 3.05 |
1.0078 times |
Fri 10 October 2025 |
2.94 (-3.61%) |
3.06 |
2.92 - 3.08 |
1.7576 times |
Fri 03 October 2025 |
3.05 (4.45%) |
2.92 |
2.89 - 3.05 |
1.2528 times |
Fri 26 September 2025 |
2.92 (4.66%) |
2.79 |
2.72 - 2.94 |
1.1504 times |
Fri 19 September 2025 |
2.79 (1.82%) |
2.74 |
2.73 - 2.95 |
1.4617 times |
Fri 12 September 2025 |
2.74 (2.24%) |
2.74 |
2.64 - 2.74 |
1.1525 times |
Fri 05 September 2025 |
2.68 (-1.11%) |
2.72 |
2.66 - 2.76 |
0.761 times |
Fri 29 August 2025 |
2.71 (0%) |
2.69 |
2.69 - 2.75 |
0.2219 times |
Fri 29 August 2025 |
2.71 (-0.37%) |
2.74 |
2.64 - 2.79 |
1.0314 times |
Fri 22 August 2025 |
2.72 (0.37%) |
2.70 |
2.60 - 2.79 |
1.603 times |

Monthly price and charts VocEnergy Strong monthly Stock price targets for VocEnergy VOC are 2.9 and 3.13 | Monthly Target 1 | 2.73 | | Monthly Target 2 | 2.83 | | Monthly Target 3 | 2.9566666666667 | | Monthly Target 4 | 3.06 | | Monthly Target 5 | 3.19 |
Monthly price and volumes Voc Energy
| Date |
Closing |
Open |
Range |
Volume |
Mon 20 October 2025 |
2.94 (0.34%) |
2.92 |
2.85 - 3.08 |
0.587 times |
Tue 30 September 2025 |
2.93 (8.12%) |
2.72 |
2.64 - 2.95 |
0.8107 times |
Fri 29 August 2025 |
2.71 (-7.82%) |
2.87 |
2.60 - 2.97 |
1.3418 times |
Thu 31 July 2025 |
2.94 (2.8%) |
2.90 |
2.78 - 3.48 |
1.3647 times |
Mon 30 June 2025 |
2.86 (-2.05%) |
2.92 |
2.72 - 3.05 |
1.0791 times |
Fri 30 May 2025 |
2.92 (-3.95%) |
3.05 |
2.78 - 3.28 |
0.806 times |
Wed 30 April 2025 |
3.04 (-3.49%) |
3.13 |
2.44 - 3.37 |
1.2184 times |
Mon 31 March 2025 |
3.15 (-3.08%) |
3.20 |
2.85 - 3.37 |
0.5745 times |
Fri 28 February 2025 |
3.25 (-17.3%) |
3.93 |
3.08 - 3.98 |
0.8747 times |
Fri 31 January 2025 |
3.93 (-17.78%) |
4.85 |
3.70 - 5.12 |
1.3432 times |
Tue 31 December 2024 |
4.78 (-1.85%) |
5.00 |
4.57 - 5.00 |
0.6905 times |

DMA SMA EMA moving averages of Voc Energy VOC
DMA (daily moving average) of Voc Energy VOC
| DMA period | DMA value | | 5 day DMA | 2.94 | | 12 day DMA | 2.98 | | 20 day DMA | 2.96 | | 35 day DMA | 2.87 | | 50 day DMA | 2.82 | | 100 day DMA | 2.88 | | 150 day DMA | 2.93 | | 200 day DMA | 3.19 | EMA (exponential moving average) of Voc Energy VOC
| EMA period | EMA current | EMA prev | EMA prev2 | | 5 day EMA | 2.95 | 2.96 | 2.96 | | 12 day EMA | 2.96 | 2.96 | 2.96 | | 20 day EMA | 2.93 | 2.93 | 2.93 | | 35 day EMA | 2.88 | 2.88 | 2.88 | | 50 day EMA | 2.84 | 2.84 | 2.83 |
SMA (simple moving average) of Voc Energy VOC
| SMA period | SMA current | SMA prev | SMA prev2 | | 5 day SMA | 2.94 | 2.94 | 2.94 | | 12 day SMA | 2.98 | 2.99 | 2.99 | | 20 day SMA | 2.96 | 2.95 | 2.94 | | 35 day SMA | 2.87 | 2.86 | 2.86 | | 50 day SMA | 2.82 | 2.82 | 2.81 | | 100 day SMA | 2.88 | 2.88 | 2.88 | | 150 day SMA | 2.93 | 2.93 | 2.93 | | 200 day SMA | 3.19 | 3.2 | 3.21 |
|
|
