VanguardGlobal VNQI full analysis,charts,indicators,moving averages,SMA,DMA,EMA,ADX,MACD,RSIVanguard Global VNQI WideScreen charts, DMA,SMA,EMA technical analysis, forecast prediction, by indicators ADX,MACD,RSI,CCI USA stock exchange
operates under N A sector & deals in N A
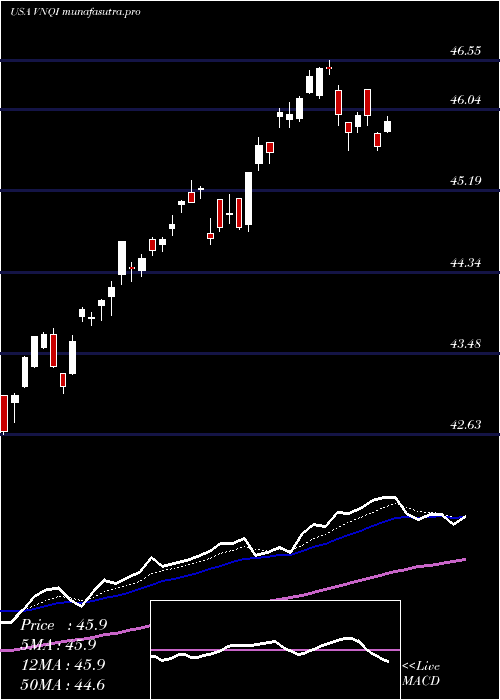
Daily price and charts and targets VanguardGlobal Strong Daily Stock price targets for VanguardGlobal VNQI are 47.27 and 47.43 | Daily Target 1 | 47.23 | | Daily Target 2 | 47.31 | | Daily Target 3 | 47.39 | | Daily Target 4 | 47.47 | | Daily Target 5 | 47.55 |
Daily price and volume Vanguard Global
| Date |
Closing |
Open |
Range |
Volume |
Thu 04 December 2025 |
47.39 (-0.36%) |
47.46 |
47.31 - 47.47 |
0.8587 times |
Wed 03 December 2025 |
47.56 (0.36%) |
47.41 |
47.41 - 47.59 |
0.7958 times |
Tue 02 December 2025 |
47.39 (0.11%) |
47.37 |
47.23 - 47.42 |
0.7792 times |
Mon 01 December 2025 |
47.34 (-1%) |
47.52 |
47.31 - 47.60 |
0.9533 times |
Fri 28 November 2025 |
47.82 (0.02%) |
47.59 |
47.58 - 47.85 |
0.3904 times |
Wed 26 November 2025 |
47.81 (0.67%) |
47.49 |
47.46 - 47.84 |
1.4809 times |
Tue 25 November 2025 |
47.49 (0.98%) |
47.11 |
47.10 - 47.51 |
0.9554 times |
Mon 24 November 2025 |
47.03 (0.28%) |
46.99 |
46.91 - 47.12 |
1.6587 times |
Fri 21 November 2025 |
46.90 (1.12%) |
46.55 |
46.47 - 46.98 |
1.0573 times |
Thu 20 November 2025 |
46.38 (-0.77%) |
46.88 |
46.36 - 46.91 |
1.0703 times |
Wed 19 November 2025 |
46.74 (-0.57%) |
46.88 |
46.59 - 46.97 |
1.1321 times |
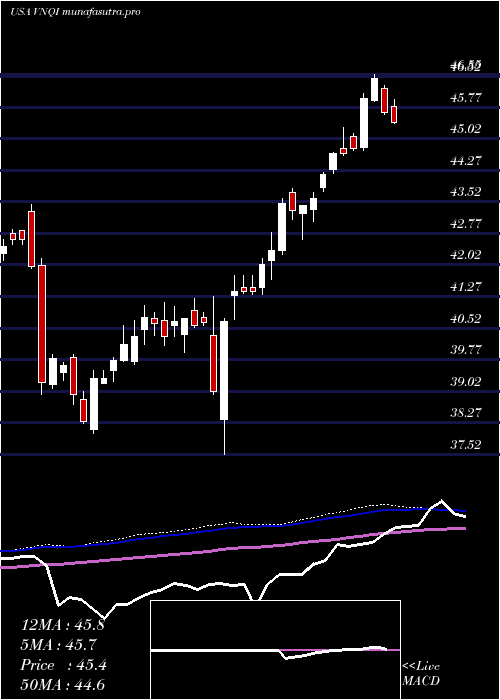
Weekly price and charts VanguardGlobal Strong weekly Stock price targets for VanguardGlobal VNQI are 47.13 and 47.5 | Weekly Target 1 | 47.04 | | Weekly Target 2 | 47.21 | | Weekly Target 3 | 47.406666666667 | | Weekly Target 4 | 47.58 | | Weekly Target 5 | 47.78 |
Weekly price and volumes for Vanguard Global
| Date |
Closing |
Open |
Range |
Volume |
Thu 04 December 2025 |
47.39 (-0.9%) |
47.52 |
47.23 - 47.60 |
0.7142 times |
Fri 28 November 2025 |
47.82 (1.96%) |
46.99 |
46.91 - 47.85 |
0.9458 times |
Fri 21 November 2025 |
46.90 (-1.43%) |
47.44 |
46.36 - 47.57 |
1.0547 times |
Fri 14 November 2025 |
47.58 (0.3%) |
47.41 |
47.27 - 48.10 |
0.9372 times |
Fri 07 November 2025 |
47.44 (0.64%) |
46.92 |
46.74 - 47.44 |
1.6124 times |
Fri 31 October 2025 |
47.14 (0%) |
47.12 |
46.99 - 47.18 |
0.2261 times |
Fri 31 October 2025 |
47.14 (-2.3%) |
48.30 |
46.99 - 48.34 |
1.0563 times |
Fri 24 October 2025 |
48.25 (1.03%) |
47.88 |
47.71 - 48.39 |
1.027 times |
Fri 17 October 2025 |
47.76 (2.31%) |
47.08 |
47.00 - 48.02 |
1.3887 times |
Fri 10 October 2025 |
46.68 (-2.57%) |
47.86 |
46.56 - 47.96 |
1.0376 times |
Fri 03 October 2025 |
47.91 (1.27%) |
47.43 |
47.39 - 48.06 |
1.5121 times |
Monthly price and charts VanguardGlobal Strong monthly Stock price targets for VanguardGlobal VNQI are 47.13 and 47.5 | Monthly Target 1 | 47.04 | | Monthly Target 2 | 47.21 | | Monthly Target 3 | 47.406666666667 | | Monthly Target 4 | 47.58 | | Monthly Target 5 | 47.78 |
Monthly price and volumes Vanguard Global
| Date |
Closing |
Open |
Range |
Volume |
Thu 04 December 2025 |
47.39 (-0.9%) |
47.52 |
47.23 - 47.60 |
0.122 times |
Fri 28 November 2025 |
47.82 (1.44%) |
46.92 |
46.36 - 48.10 |
0.7775 times |
Fri 31 October 2025 |
47.14 (-1.26%) |
47.82 |
46.56 - 48.39 |
1.0045 times |
Tue 30 September 2025 |
47.74 (1.36%) |
46.38 |
46.31 - 48.54 |
1.2466 times |
Fri 29 August 2025 |
47.10 (4.16%) |
45.40 |
45.32 - 47.89 |
1.0695 times |
Thu 31 July 2025 |
45.22 (-2.02%) |
46.21 |
45.13 - 46.70 |
1.0203 times |
Mon 30 June 2025 |
46.15 (4.48%) |
44.31 |
44.21 - 46.17 |
1.1285 times |
Fri 30 May 2025 |
44.17 (2.96%) |
43.00 |
42.63 - 44.23 |
1.6099 times |
Wed 30 April 2025 |
42.90 (6.03%) |
40.63 |
37.52 - 42.96 |
1.3487 times |
Mon 31 March 2025 |
40.46 (0.35%) |
40.57 |
39.93 - 41.23 |
0.6724 times |
Fri 28 February 2025 |
40.32 (0.5%) |
39.72 |
39.66 - 41.13 |
0.7965 times |
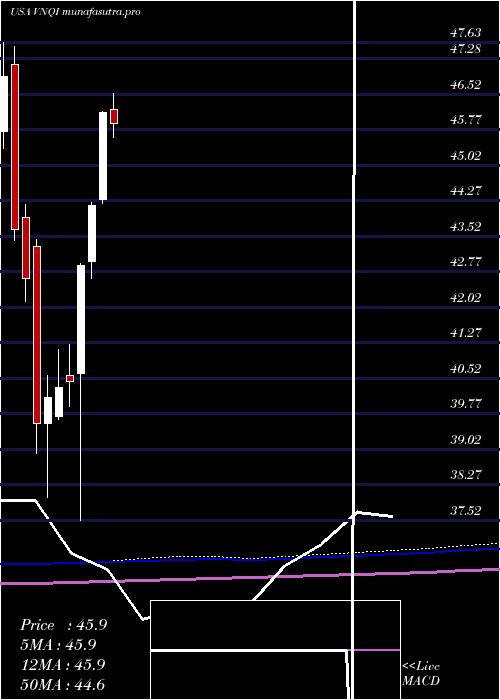
DMA SMA EMA moving averages of Vanguard Global VNQI
DMA (daily moving average) of Vanguard Global VNQI
| DMA period | DMA value | | 5 day DMA | 47.5 | | 12 day DMA | 47.24 | | 20 day DMA | 47.36 | | 35 day DMA | 47.51 | | 50 day DMA | 47.48 | | 100 day DMA | 47.23 | | 150 day DMA | 46.35 | | 200 day DMA | 44.97 | EMA (exponential moving average) of Vanguard Global VNQI
| EMA period | EMA current | EMA prev | EMA prev2 | | 5 day EMA | 47.44 | 47.47 | 47.43 | | 12 day EMA | 47.39 | 47.39 | 47.36 | | 20 day EMA | 47.4 | 47.4 | 47.38 | | 35 day EMA | 47.44 | 47.44 | 47.43 | | 50 day EMA | 47.5 | 47.5 | 47.5 |
SMA (simple moving average) of Vanguard Global VNQI
| SMA period | SMA current | SMA prev | SMA prev2 | | 5 day SMA | 47.5 | 47.58 | 47.57 | | 12 day SMA | 47.24 | 47.22 | 47.23 | | 20 day SMA | 47.36 | 47.34 | 47.3 | | 35 day SMA | 47.51 | 47.51 | 47.51 | | 50 day SMA | 47.48 | 47.48 | 47.49 | | 100 day SMA | 47.23 | 47.21 | 47.19 | | 150 day SMA | 46.35 | 46.32 | 46.29 | | 200 day SMA | 44.97 | 44.93 | 44.9 |
|
|
