21vianetGroup VNET full analysis,charts,indicators,moving averages,SMA,DMA,EMA,ADX,MACD,RSI21vianet Group VNET WideScreen charts, DMA,SMA,EMA technical analysis, forecast prediction, by indicators ADX,MACD,RSI,CCI USA stock exchange
operates under Technology sector & deals in Computer Software Programming Data Processing
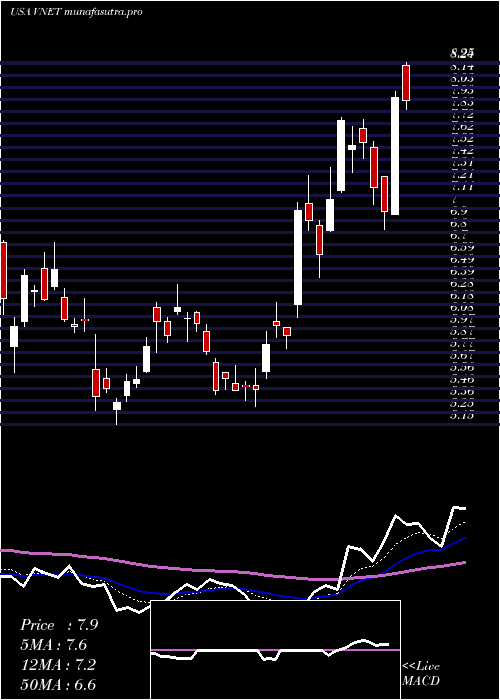
Daily price and charts and targets 21vianetGroup Strong Daily Stock price targets for 21vianetGroup VNET are 9.15 and 9.71 | Daily Target 1 | 8.7 | | Daily Target 2 | 9.04 | | Daily Target 3 | 9.2633333333333 | | Daily Target 4 | 9.6 | | Daily Target 5 | 9.82 |
Daily price and volume 21vianet Group
| Date |
Closing |
Open |
Range |
Volume |
Mon 20 October 2025 |
9.37 (7.33%) |
8.95 |
8.93 - 9.49 |
0.6149 times |
Fri 17 October 2025 |
8.73 (-3%) |
8.60 |
8.30 - 9.01 |
0.5033 times |
Thu 16 October 2025 |
9.00 (-6.15%) |
9.63 |
9.00 - 9.70 |
0.8389 times |
Wed 15 October 2025 |
9.59 (4.47%) |
9.50 |
9.33 - 9.72 |
1.1569 times |
Tue 14 October 2025 |
9.18 (-2.44%) |
8.81 |
8.72 - 9.19 |
0.7961 times |
Mon 13 October 2025 |
9.41 (10.58%) |
9.23 |
9.00 - 9.58 |
1.0614 times |
Fri 10 October 2025 |
8.51 (-11.17%) |
9.47 |
8.37 - 9.62 |
2.3182 times |
Thu 09 October 2025 |
9.58 (-3.13%) |
9.85 |
9.41 - 9.96 |
0.9294 times |
Wed 08 October 2025 |
9.89 (-0.4%) |
10.03 |
9.82 - 10.15 |
0.5816 times |
Tue 07 October 2025 |
9.93 (-6.32%) |
10.63 |
9.63 - 10.73 |
1.1994 times |
Mon 06 October 2025 |
10.60 (-1.3%) |
10.60 |
10.53 - 10.94 |
0.4492 times |
Weekly price and charts 21vianetGroup Strong weekly Stock price targets for 21vianetGroup VNET are 9.15 and 9.71 | Weekly Target 1 | 8.7 | | Weekly Target 2 | 9.04 | | Weekly Target 3 | 9.2633333333333 | | Weekly Target 4 | 9.6 | | Weekly Target 5 | 9.82 |
Weekly price and volumes for 21vianet Group
| Date |
Closing |
Open |
Range |
Volume |
Mon 20 October 2025 |
9.37 (7.33%) |
8.95 |
8.93 - 9.49 |
0.1181 times |
Fri 17 October 2025 |
8.73 (2.59%) |
9.23 |
8.30 - 9.72 |
0.8367 times |
Fri 10 October 2025 |
8.51 (-20.76%) |
10.60 |
8.37 - 10.94 |
1.052 times |
Fri 03 October 2025 |
10.74 (-0.56%) |
11.18 |
10.12 - 11.80 |
0.9313 times |
Fri 26 September 2025 |
10.80 (12.15%) |
9.93 |
9.11 - 11.68 |
2.0366 times |
Fri 19 September 2025 |
9.63 (0.63%) |
9.65 |
8.92 - 10.19 |
1.3437 times |
Fri 12 September 2025 |
9.57 (21.14%) |
8.12 |
7.68 - 9.70 |
1.2311 times |
Fri 05 September 2025 |
7.90 (-8.78%) |
8.35 |
7.37 - 8.51 |
0.8029 times |
Fri 29 August 2025 |
8.66 (0%) |
8.90 |
8.46 - 9.14 |
0.4654 times |
Fri 29 August 2025 |
8.66 (4.46%) |
8.39 |
7.66 - 9.14 |
1.1822 times |
Fri 22 August 2025 |
8.29 (6.69%) |
7.93 |
7.27 - 8.73 |
1.0108 times |
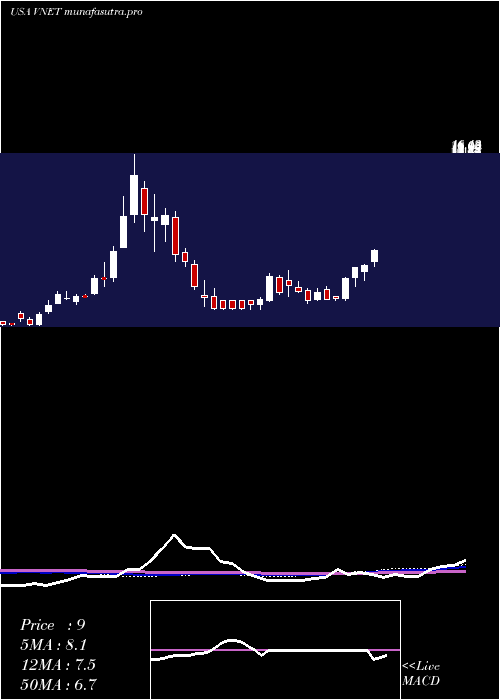
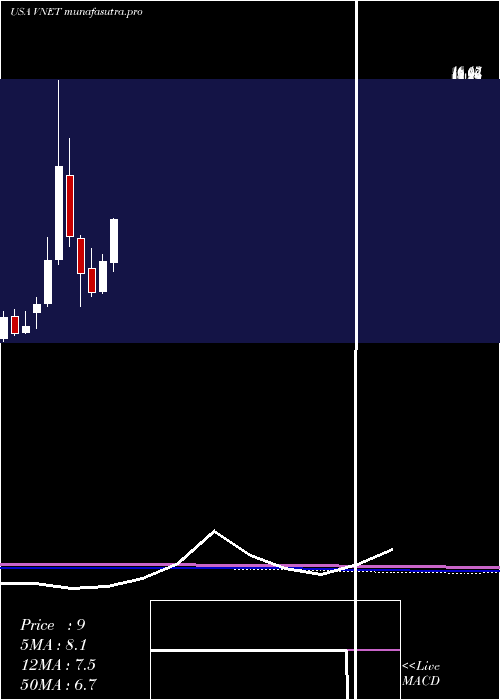
Monthly price and charts 21vianetGroup Strong monthly Stock price targets for 21vianetGroup VNET are 7.09 and 10.59 | Monthly Target 1 | 6.32 | | Monthly Target 2 | 7.85 | | Monthly Target 3 | 9.8233333333333 | | Monthly Target 4 | 11.35 | | Monthly Target 5 | 13.32 |
Monthly price and volumes 21vianet Group
| Date |
Closing |
Open |
Range |
Volume |
Mon 20 October 2025 |
9.37 (-9.29%) |
10.31 |
8.30 - 11.80 |
0.4984 times |
Tue 30 September 2025 |
10.33 (19.28%) |
8.35 |
7.37 - 11.68 |
1.1683 times |
Fri 29 August 2025 |
8.66 (4.21%) |
7.89 |
7.17 - 9.14 |
0.8208 times |
Thu 31 July 2025 |
8.31 (20.43%) |
6.85 |
6.41 - 9.42 |
1.1219 times |
Mon 30 June 2025 |
6.90 (29.21%) |
5.40 |
5.31 - 7.28 |
0.6058 times |
Fri 30 May 2025 |
5.34 (-15.1%) |
6.54 |
5.15 - 7.56 |
0.8723 times |
Wed 30 April 2025 |
6.29 (-23.29%) |
8.07 |
4.65 - 8.23 |
1.072 times |
Mon 31 March 2025 |
8.20 (-30.09%) |
11.29 |
7.68 - 13.16 |
1.4839 times |
Fri 28 February 2025 |
11.73 (68.29%) |
7.04 |
6.75 - 16.13 |
1.6543 times |
Fri 31 January 2025 |
6.97 (47.05%) |
4.76 |
4.61 - 8.14 |
0.7022 times |
Tue 31 December 2024 |
4.74 (32.03%) |
4.35 |
3.52 - 5.08 |
0.2813 times |
DMA SMA EMA moving averages of 21vianet Group VNET
DMA (daily moving average) of 21vianet Group VNET
| DMA period | DMA value | | 5 day DMA | 9.17 | | 12 day DMA | 9.54 | | 20 day DMA | 9.95 | | 35 day DMA | 9.48 | | 50 day DMA | 9.04 | | 100 day DMA | 8.04 | | 150 day DMA | 7.54 | | 200 day DMA | 7.93 | EMA (exponential moving average) of 21vianet Group VNET
| EMA period | EMA current | EMA prev | EMA prev2 | | 5 day EMA | 9.2 | 9.11 | 9.3 | | 12 day EMA | 9.45 | 9.47 | 9.6 | | 20 day EMA | 9.52 | 9.54 | 9.63 | | 35 day EMA | 9.31 | 9.31 | 9.34 | | 50 day EMA | 8.97 | 8.95 | 8.96 |
SMA (simple moving average) of 21vianet Group VNET
| SMA period | SMA current | SMA prev | SMA prev2 | | 5 day SMA | 9.17 | 9.18 | 9.14 | | 12 day SMA | 9.54 | 9.7 | 9.87 | | 20 day SMA | 9.95 | 9.98 | 10.03 | | 35 day SMA | 9.48 | 9.46 | 9.46 | | 50 day SMA | 9.04 | 9.01 | 9 | | 100 day SMA | 8.04 | 8.01 | 7.98 | | 150 day SMA | 7.54 | 7.55 | 7.56 | | 200 day SMA | 7.93 | 7.91 | 7.89 |
|
|
