ValleyNational VLY full analysis,charts,indicators,moving averages,SMA,DMA,EMA,ADX,MACD,RSIValley National VLY WideScreen charts, DMA,SMA,EMA technical analysis, forecast prediction, by indicators ADX,MACD,RSI,CCI USA stock exchange
operates under Finance sector & deals in Major Banks
Daily price and charts and targets ValleyNational Strong Daily Stock price targets for ValleyNational VLY are 10.01 and 10.45 | Daily Target 1 | 9.65 | | Daily Target 2 | 9.93 | | Daily Target 3 | 10.086666666667 | | Daily Target 4 | 10.37 | | Daily Target 5 | 10.53 |
Daily price and volume Valley National
| Date |
Closing |
Open |
Range |
Volume |
Mon 20 October 2025 |
10.22 (4.29%) |
9.85 |
9.80 - 10.24 |
1.0135 times |
Fri 17 October 2025 |
9.80 (0.82%) |
9.89 |
9.72 - 9.92 |
1.0705 times |
Thu 16 October 2025 |
9.72 (-7.25%) |
10.40 |
9.64 - 10.40 |
1.5896 times |
Wed 15 October 2025 |
10.48 (-2.87%) |
10.81 |
10.34 - 10.87 |
1.4474 times |
Tue 14 October 2025 |
10.79 (2.27%) |
10.47 |
10.40 - 10.90 |
1.3491 times |
Mon 13 October 2025 |
10.55 (2.33%) |
10.60 |
10.46 - 10.60 |
0.9531 times |
Fri 10 October 2025 |
10.31 (-5.33%) |
10.98 |
10.30 - 11.01 |
0.7932 times |
Thu 09 October 2025 |
10.89 (0.46%) |
10.85 |
10.76 - 10.95 |
0.509 times |
Wed 08 October 2025 |
10.84 (0.09%) |
10.93 |
10.77 - 10.97 |
0.461 times |
Tue 07 October 2025 |
10.83 (-0.73%) |
10.92 |
10.77 - 11.10 |
0.8135 times |
Mon 06 October 2025 |
10.91 (2.54%) |
10.71 |
10.67 - 11.17 |
0.9838 times |
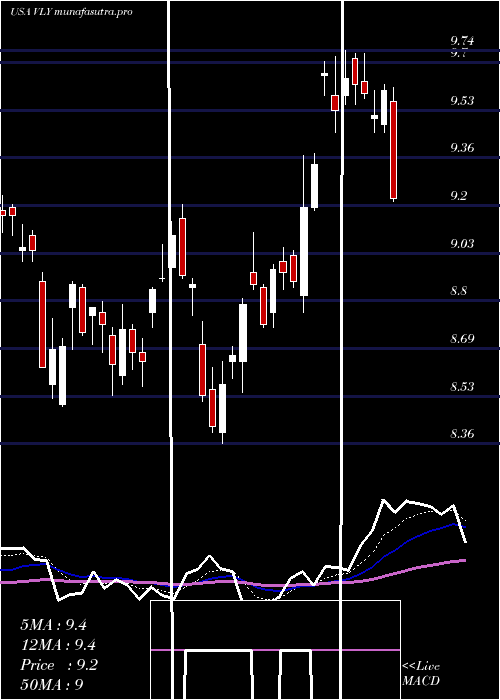
Weekly price and charts ValleyNational Strong weekly Stock price targets for ValleyNational VLY are 10.01 and 10.45 | Weekly Target 1 | 9.65 | | Weekly Target 2 | 9.93 | | Weekly Target 3 | 10.086666666667 | | Weekly Target 4 | 10.37 | | Weekly Target 5 | 10.53 |
Weekly price and volumes for Valley National
| Date |
Closing |
Open |
Range |
Volume |
Mon 20 October 2025 |
10.22 (4.29%) |
9.85 |
9.80 - 10.24 |
0.3668 times |
Fri 17 October 2025 |
9.80 (-4.95%) |
10.60 |
9.64 - 10.90 |
2.3198 times |
Fri 10 October 2025 |
10.31 (-3.1%) |
10.71 |
10.30 - 11.17 |
1.2887 times |
Fri 03 October 2025 |
10.64 (-0.37%) |
10.79 |
10.39 - 10.83 |
1.0708 times |
Fri 26 September 2025 |
10.68 (-2.47%) |
10.90 |
10.56 - 11.14 |
1.0444 times |
Fri 19 September 2025 |
10.95 (1.48%) |
10.79 |
10.46 - 11.12 |
1.2595 times |
Fri 12 September 2025 |
10.79 (0.56%) |
10.76 |
10.52 - 11.01 |
0.9271 times |
Fri 05 September 2025 |
10.73 (2.58%) |
10.28 |
10.09 - 10.83 |
0.7725 times |
Fri 29 August 2025 |
10.46 (0%) |
10.47 |
10.44 - 10.56 |
0.1532 times |
Fri 29 August 2025 |
10.46 (1.45%) |
10.24 |
10.23 - 10.59 |
0.7972 times |
Fri 22 August 2025 |
10.31 (4.99%) |
9.82 |
9.65 - 10.34 |
0.8717 times |
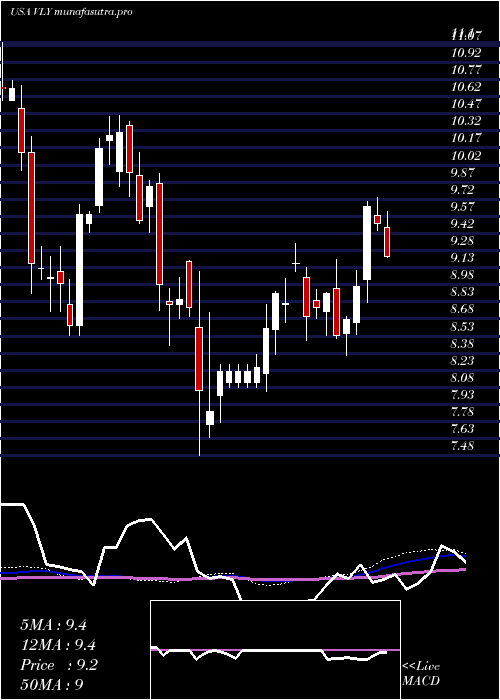
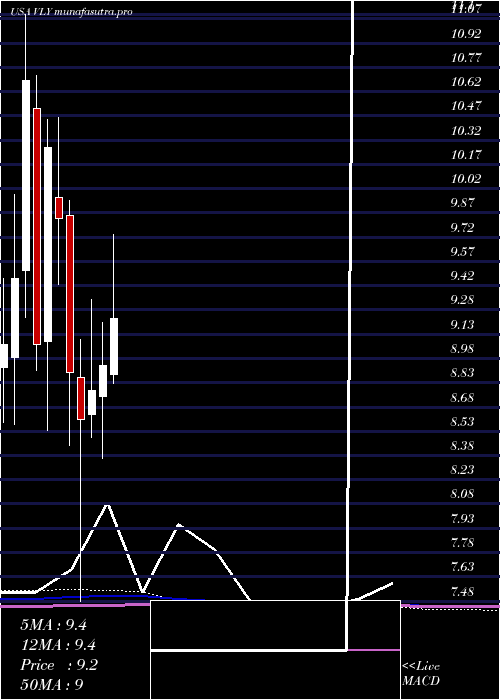
Monthly price and charts ValleyNational Strong monthly Stock price targets for ValleyNational VLY are 9.17 and 10.7 | Monthly Target 1 | 8.81 | | Monthly Target 2 | 9.52 | | Monthly Target 3 | 10.343333333333 | | Monthly Target 4 | 11.05 | | Monthly Target 5 | 11.87 |
Monthly price and volumes Valley National
| Date |
Closing |
Open |
Range |
Volume |
Mon 20 October 2025 |
10.22 (-3.58%) |
10.62 |
9.64 - 11.17 |
1.0879 times |
Tue 30 September 2025 |
10.60 (1.34%) |
10.28 |
10.09 - 11.14 |
1.0329 times |
Fri 29 August 2025 |
10.46 (12.84%) |
9.18 |
8.95 - 10.59 |
0.88 times |
Thu 31 July 2025 |
9.27 (3.81%) |
8.88 |
8.82 - 9.74 |
1.0693 times |
Mon 30 June 2025 |
8.93 (1.71%) |
8.74 |
8.36 - 9.20 |
1.0291 times |
Fri 30 May 2025 |
8.78 (2.09%) |
8.63 |
8.49 - 9.34 |
0.984 times |
Wed 30 April 2025 |
8.60 (-3.26%) |
8.86 |
7.48 - 9.09 |
1.2148 times |
Mon 31 March 2025 |
8.89 (-9.65%) |
9.86 |
8.44 - 9.95 |
0.7849 times |
Fri 28 February 2025 |
9.84 (-4.28%) |
9.97 |
9.43 - 10.46 |
0.8467 times |
Fri 31 January 2025 |
10.28 (13.47%) |
9.08 |
8.53 - 10.45 |
1.0703 times |
Tue 31 December 2024 |
9.06 (-15.25%) |
10.52 |
8.90 - 10.72 |
0.5422 times |
DMA SMA EMA moving averages of Valley National VLY
DMA (daily moving average) of Valley National VLY
| DMA period | DMA value | | 5 day DMA | 10.2 | | 12 day DMA | 10.5 | | 20 day DMA | 10.56 | | 35 day DMA | 10.63 | | 50 day DMA | 10.47 | | 100 day DMA | 9.81 | | 150 day DMA | 9.42 | | 200 day DMA | 9.46 | EMA (exponential moving average) of Valley National VLY
| EMA period | EMA current | EMA prev | EMA prev2 | | 5 day EMA | 10.17 | 10.14 | 10.31 | | 12 day EMA | 10.37 | 10.4 | 10.51 | | 20 day EMA | 10.46 | 10.48 | 10.55 | | 35 day EMA | 10.41 | 10.42 | 10.46 | | 50 day EMA | 10.34 | 10.35 | 10.37 |
SMA (simple moving average) of Valley National VLY
| SMA period | SMA current | SMA prev | SMA prev2 | | 5 day SMA | 10.2 | 10.27 | 10.37 | | 12 day SMA | 10.5 | 10.53 | 10.59 | | 20 day SMA | 10.56 | 10.59 | 10.64 | | 35 day SMA | 10.63 | 10.64 | 10.65 | | 50 day SMA | 10.47 | 10.45 | 10.44 | | 100 day SMA | 9.81 | 9.8 | 9.79 | | 150 day SMA | 9.42 | 9.41 | 9.4 | | 200 day SMA | 9.46 | 9.45 | 9.45 |
|
|
