VisterraInc VIST full analysis,charts,indicators,moving averages,SMA,DMA,EMA,ADX,MACD,RSIVisterra Inc VIST WideScreen charts, DMA,SMA,EMA technical analysis, forecast prediction, by indicators ADX,MACD,RSI,CCI USA stock exchange
operates under N A sector & deals in N A
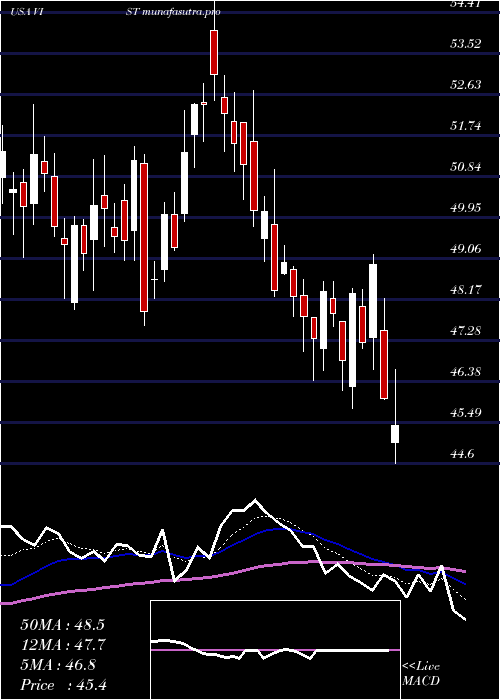
Daily price and charts and targets VisterraInc Strong Daily Stock price targets for VisterraInc VIST are 34.39 and 35.77 | Daily Target 1 | 34.13 | | Daily Target 2 | 34.65 | | Daily Target 3 | 35.513333333333 | | Daily Target 4 | 36.03 | | Daily Target 5 | 36.89 |
Daily price and volume Visterra Inc
| Date |
Closing |
Open |
Range |
Volume |
Mon 20 October 2025 |
35.16 (-1.79%) |
35.66 |
35.00 - 36.38 |
0.5409 times |
Fri 17 October 2025 |
35.80 (0.48%) |
34.69 |
34.69 - 36.04 |
0.3842 times |
Thu 16 October 2025 |
35.63 (-0.86%) |
36.10 |
35.04 - 36.39 |
0.5399 times |
Wed 15 October 2025 |
35.94 (2.16%) |
35.69 |
35.10 - 36.95 |
0.9201 times |
Tue 14 October 2025 |
35.18 (-7.79%) |
37.25 |
34.99 - 38.71 |
1.6149 times |
Mon 13 October 2025 |
38.15 (2.66%) |
37.30 |
37.25 - 38.36 |
0.8288 times |
Fri 10 October 2025 |
37.16 (-0.3%) |
38.06 |
36.71 - 38.52 |
2.3633 times |
Thu 09 October 2025 |
37.27 (6.88%) |
34.96 |
34.96 - 37.66 |
1.355 times |
Wed 08 October 2025 |
34.87 (1.04%) |
34.75 |
33.90 - 35.01 |
0.6654 times |
Tue 07 October 2025 |
34.51 (-2.82%) |
35.97 |
34.26 - 35.97 |
0.7875 times |
Mon 06 October 2025 |
35.51 (2.84%) |
34.71 |
33.30 - 36.00 |
0.5525 times |
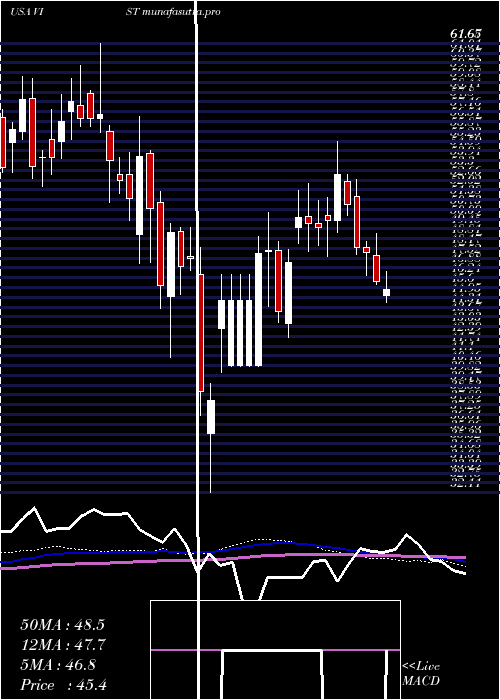
Weekly price and charts VisterraInc Strong weekly Stock price targets for VisterraInc VIST are 34.39 and 35.77 | Weekly Target 1 | 34.13 | | Weekly Target 2 | 34.65 | | Weekly Target 3 | 35.513333333333 | | Weekly Target 4 | 36.03 | | Weekly Target 5 | 36.89 |
Weekly price and volumes for Visterra Inc
| Date |
Closing |
Open |
Range |
Volume |
Mon 20 October 2025 |
35.16 (-1.79%) |
35.66 |
35.00 - 36.38 |
0.1236 times |
Fri 17 October 2025 |
35.80 (-3.66%) |
37.30 |
34.69 - 38.71 |
0.9798 times |
Fri 10 October 2025 |
37.16 (7.62%) |
34.71 |
33.30 - 38.52 |
1.3078 times |
Fri 03 October 2025 |
34.53 (-4.53%) |
36.31 |
33.45 - 36.31 |
1.2041 times |
Fri 26 September 2025 |
36.17 (7.33%) |
37.29 |
36.10 - 40.78 |
1.443 times |
Fri 19 September 2025 |
33.70 (-5.63%) |
35.81 |
33.37 - 37.25 |
1.2064 times |
Fri 12 September 2025 |
35.71 (-6.22%) |
32.31 |
31.63 - 38.73 |
1.8272 times |
Fri 05 September 2025 |
38.08 (-2.31%) |
38.65 |
37.52 - 39.32 |
0.9396 times |
Fri 29 August 2025 |
38.98 (0%) |
39.25 |
38.59 - 39.77 |
0.1121 times |
Fri 29 August 2025 |
38.98 (-3.35%) |
40.04 |
38.26 - 40.09 |
0.8564 times |
Fri 22 August 2025 |
40.33 (-2.82%) |
41.43 |
39.62 - 42.14 |
0.8171 times |
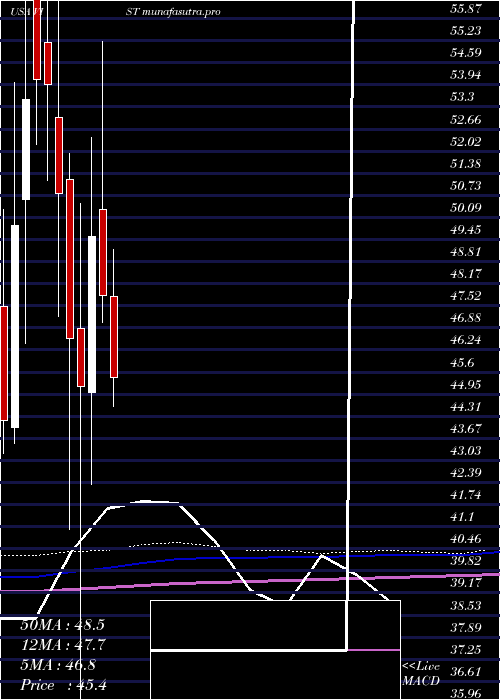
Monthly price and charts VisterraInc Strong monthly Stock price targets for VisterraInc VIST are 34.23 and 39.64 | Monthly Target 1 | 30.31 | | Monthly Target 2 | 32.74 | | Monthly Target 3 | 35.723333333333 | | Monthly Target 4 | 38.15 | | Monthly Target 5 | 41.13 |
Monthly price and volumes Visterra Inc
| Date |
Closing |
Open |
Range |
Volume |
Mon 20 October 2025 |
35.16 (2.21%) |
34.10 |
33.30 - 38.71 |
0.8713 times |
Tue 30 September 2025 |
34.40 (-11.75%) |
38.65 |
31.63 - 40.78 |
1.6022 times |
Fri 29 August 2025 |
38.98 (-12.8%) |
44.83 |
38.26 - 46.69 |
0.9369 times |
Thu 31 July 2025 |
44.70 (-6.5%) |
47.78 |
42.69 - 49.15 |
1.0847 times |
Mon 30 June 2025 |
47.81 (-3.47%) |
50.32 |
47.05 - 55.20 |
0.6296 times |
Fri 30 May 2025 |
49.53 (9.65%) |
45.00 |
42.32 - 52.41 |
0.8056 times |
Wed 30 April 2025 |
45.17 (-2.99%) |
46.87 |
32.11 - 50.50 |
1.4259 times |
Mon 31 March 2025 |
46.56 (-8.31%) |
51.20 |
41.02 - 51.94 |
0.8476 times |
Fri 28 February 2025 |
50.78 (-5.88%) |
53.01 |
47.21 - 56.85 |
0.8255 times |
Fri 31 January 2025 |
53.95 (-0.3%) |
55.17 |
51.18 - 61.67 |
0.9708 times |
Tue 31 December 2024 |
54.11 (1.1%) |
56.47 |
52.21 - 59.47 |
0.5784 times |
DMA SMA EMA moving averages of Visterra Inc VIST
DMA (daily moving average) of Visterra Inc VIST
| DMA period | DMA value | | 5 day DMA | 35.54 | | 12 day DMA | 35.81 | | 20 day DMA | 35.81 | | 35 day DMA | 36.17 | | 50 day DMA | 37.44 | | 100 day DMA | 42.44 | | 150 day DMA | 43.52 | | 200 day DMA | 45.81 | EMA (exponential moving average) of Visterra Inc VIST
| EMA period | EMA current | EMA prev | EMA prev2 | | 5 day EMA | 35.67 | 35.92 | 35.98 | | 12 day EMA | 35.79 | 35.91 | 35.93 | | 20 day EMA | 35.99 | 36.08 | 36.11 | | 35 day EMA | 36.92 | 37.02 | 37.09 | | 50 day EMA | 37.79 | 37.9 | 37.99 |
SMA (simple moving average) of Visterra Inc VIST
| SMA period | SMA current | SMA prev | SMA prev2 | | 5 day SMA | 35.54 | 36.14 | 36.41 | | 12 day SMA | 35.81 | 35.74 | 35.56 | | 20 day SMA | 35.81 | 35.87 | 35.77 | | 35 day SMA | 36.17 | 36.28 | 36.37 | | 50 day SMA | 37.44 | 37.6 | 37.73 | | 100 day SMA | 42.44 | 42.58 | 42.72 | | 150 day SMA | 43.52 | 43.61 | 43.7 | | 200 day SMA | 45.81 | 45.91 | 46.01 |
|
|
